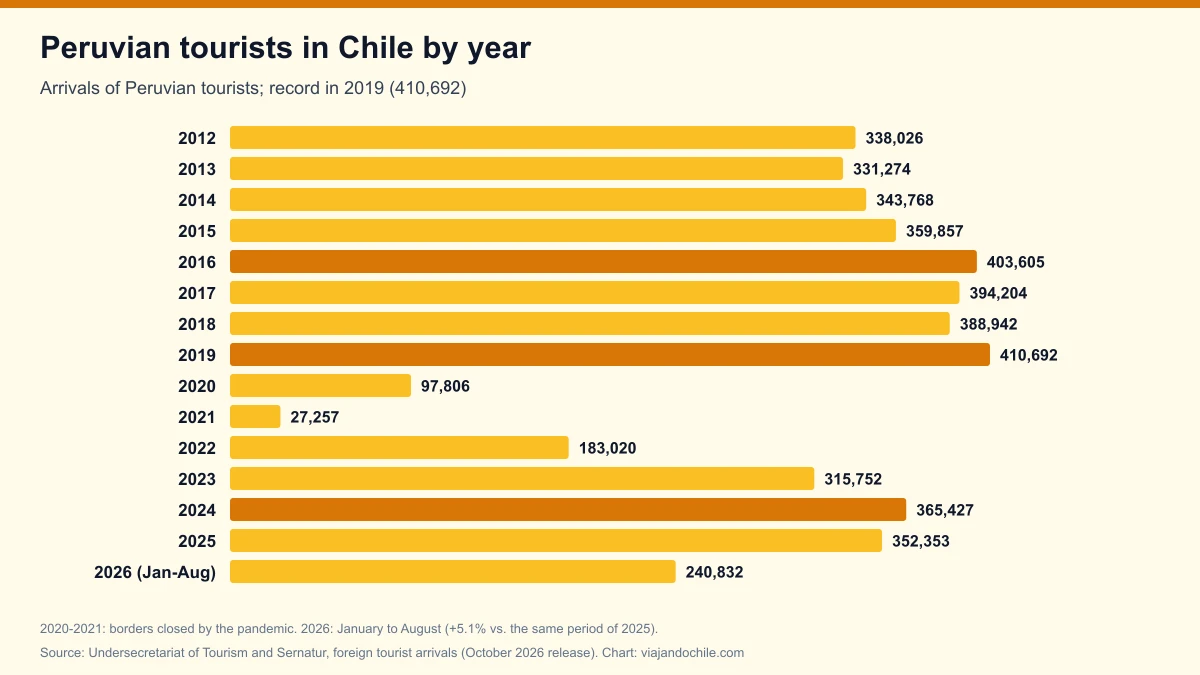
From January to August 2026, 240,832 Peruvian tourists arrived in Chile, 5.1% more than in the same period of 2025 (229,123). Peru is the fourth-largest source of tourists visiting Chile, behind Argentina, Brazil and Bolivia, and accounts for 7.3% of this year's arrivals, according to the foreign tourist arrivals published by the Undersecretariat of Tourism and Sernatur, based on records from the Investigations Police (PDI).
*Updated on November 1, 2026, with the October 2026 release (data through August 2026).* Figures count tourists of Peruvian nationality and exclude arrivals by sea. Figures from 2020 onward are preliminary.
Peruvian tourists in Chile by year
| Year | Peruvian tourists | % of all tourists |
|---|---|---|
| 2008 | 252,472 | 9.3% |
| 2012 | 338,026 | 9.5% |
| 2015 | 359,857 | 8.0% |
| 2016 | 403,605 | 7.2% |
| 2017 | 394,204 | 6.1% |
| 2018 | 388,942 | 6.8% |
| 2019 | 410,692 | 9.1% |
| 2020 | 97,806 | 8.7% |
| 2021 | 27,257 | 14.3% |
| 2022 | 183,020 | 9.0% |
| 2023 | 315,752 | 8.5% |
| 2024 | 365,427 | 7.0% |
| 2025 | 352,353 | 5.9% |
| 2026 (January to August) | 240,832 | 7.3% |
Source: Undersecretariat of Tourism and Sernatur, "Cuadro por Nacionalidad" sheet. Percentages calculated by Viajando Chile. The annual record for Peruvian tourists is 2019, with 410,692. In 2025, 352,353 arrived, 3.6% fewer than in 2024. If as many arrive from September to December 2026 as in those months of 2025 (123,230), the year would close at around 364,000, in line with 2024; that is our own projection, not an official figure.
The series shows steady demand, without the swings that Argentine arrivals show with the exchange rate. In 2021, with borders closed for most of the year, Peru became the second-largest source country, with 14.3% of tourists. Figures for Argentina, Brazil and the United States are in Argentine tourists, Brazilian tourists and US tourists in Chile.
Peruvian tourists in Chile in 2026, month by month
| Month | 2026 | 2025 | Change | % of the month's tourists (2026) |
|---|---|---|---|---|
| January | 35,658 | 35,007 | +1.9% | 5.0% |
| February | 27,816 | 27,852 | -0.1% | 5.5% |
| March | 35,913 | 28,209 | +27.3% | 8.0% |
| April | 27,122 | 25,898 | +4.7% | 7.9% |
| May | 25,789 | 24,592 | +4.9% | 9.3% |
| June | 23,426 | 23,829 | -1.7% | 8.8% |
| July | 33,452 | 32,213 | +3.8% | 8.2% |
| August | 31,656 | 31,523 | +0.4% | 9.2% |
| January to August | 240,832 | 229,123 | +5.1% | 7.3% |
Source: Undersecretariat of Tourism and Sernatur. Changes and shares calculated by Viajando Chile. Unlike Europeans, Peruvians travel all year, with peaks in January, July and August, their school and mid-year holidays. March 2026 was the best month of the year, with 35,913 Peruvians and a 27.3% rise. The busiest month for Peruvians in the whole series was July 2016, with 41,141.

How Peruvian tourists enter Chile
| Point of entry | 2026 (January to August) | % 2026 | 2025 | % 2025 |
|---|---|---|---|---|
| Arturo Merino Benítez Airport (Santiago) | 124,615 | 51.7% | 178,519 | 50.7% |
| Concordia (Chacalluta, Arica) | 99,869 | 41.5% | 144,369 | 41.0% |
| Cristo Redentor System (Los Libertadores) | 7,477 | 3.1% | 14,918 | 4.2% |
| Jama (San Pedro de Atacama) | 2,955 | 1.2% | 5,575 | 1.6% |
| Cerro Moreno Airport (Antofagasta) | 1,321 | 0.5% | 2,329 | 0.7% |
| Colchane | 1,063 | 0.4% | 1,259 | 0.4% |
Source: Undersecretariat of Tourism and Sernatur, "Consulta desagregada" sheet (Peruvian nationality). Calculated by Viajando Chile. One in two Peruvians flies into Santiago and four in ten cross at Chacalluta, the crossing that links Tacna with Arica. It is the main land crossing in the north, as shown in Chile's busiest border crossings for tourists. By air, the Lima-Santiago route is one of the busiest in the region; in October SKY and GOL added a codeshare between Chile, Peru and Brazil.
Does your hotel, shop or agency welcome Peruvian tourists? Reach them while they plan their trip, with Viajando Chile.
See advertising optionsHow much Peruvian tourists spend in Chile
| Indicator (2023) | Peruvian tourist | Average of all tourists |
|---|---|---|
| Total spend per tourist | US$419 | US$637 |
| Daily spend | US$23.5 | US$47.2 |
| Nights of stay | 17.8 | 13.5 |
| Total foreign exchange | US$134.9 million (5.7%) | US$2,374.8 million |
Source: Sernatur, inbound tourism tables, 2023. Peruvians stay more nights than average but spend half as much per day as the average tourist. Even so, in 2023 they were the fourth country by foreign exchange, after Brazil, Argentina and the United States. The full comparison is in how much foreign tourists spend in Chile.
Frequently asked questions
How many Peruvian tourists visit Chile each year?
In 2025, 352,353 arrived, 5.9% of all foreign tourists. From January to August 2026, 240,832 arrived, 5.1% more than a year earlier.
Where does Peru rank among countries visiting Chile?
Fourth, behind Argentina, Brazil and Bolivia, both in 2025 and so far in 2026.
What was the record year for Peruvians in Chile?
2019, with 410,692 Peruvian tourists.
Where do most Peruvians enter Chile?
Through Santiago airport (51.7% in 2026) and the Chacalluta crossing in Arica (41.5%).
How to cite this data
Viajando Chile (2026). *Peruvian tourists in Chile 2026: 240,832 arrivals through August, up 5.1% on 2025*. Based on data from Chile's Undersecretariat of Tourism and Sernatur. Available at: https://viajandochile.com/en/news/peruvian-tourists-in-chile-statistics