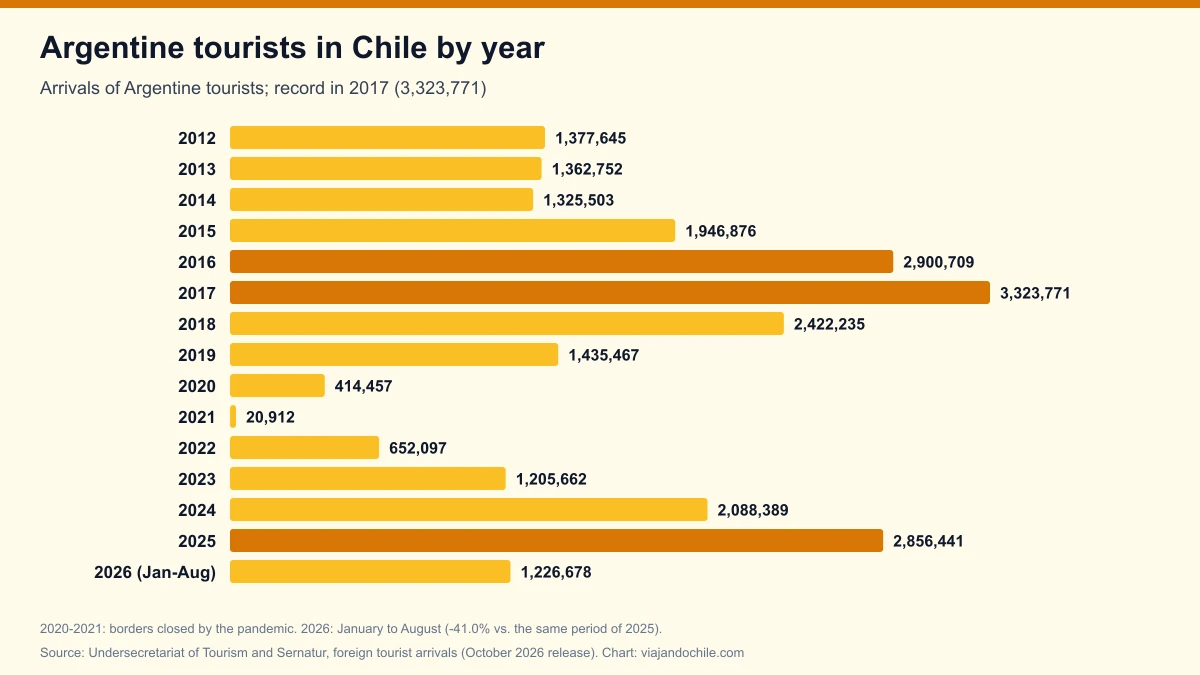
Between January and August 2026, 1,226,678 Argentine tourists arrived in Chile, 41.0% fewer than in the same period of 2025 (2,077,437). Even so, Argentina remains the country's top market, accounting for 37.1% of foreign tourists this year, according to the foreign tourist arrivals data of Chile's Undersecretariat of Tourism and Sernatur, compiled from Investigations Police (PDI) records.
*Updated October 30, 2026, with the October 2026 release (data through August 2026).* Figures refer to tourists of Argentine nationality and exclude entries through seaports. Figures from 2020 onward are preliminary.
Argentine tourists in Chile by year
| Year | Argentine tourists | % of all tourists |
|---|---|---|
| 2008 | 863,897 | 31.9% |
| 2012 | 1,377,645 | 38.8% |
| 2015 | 1,946,876 | 43.5% |
| 2016 | 2,900,709 | 51.4% |
| 2017 | 3,323,771 | 51.5% |
| 2018 | 2,422,235 | 42.3% |
| 2019 | 1,435,467 | 31.8% |
| 2020 | 414,457 | 37.0% |
| 2021 | 20,912 | 11.0% |
| 2022 | 652,097 | 32.1% |
| 2023 | 1,205,662 | 32.3% |
| 2024 | 2,088,389 | 39.9% |
| 2025 | 2,856,441 | 47.6% |
| 2026 (January to August) | 1,226,678 | 37.1% |
Source: Undersecretariat of Tourism and Sernatur, "Cuadro por Nacionalidad" sheet. Percentages: Viajando Chile's calculation. The annual record is 2017, with 3,323,771 Argentines, more than half of that year's tourists. Argentina was the top country of origin every year in the series except 2021, when land borders were closed most of the year and it came third, behind Colombia and Peru.
The series shows how Argentine arrivals track the exchange rate and their country's economy: they rise sharply in 2016-2017 and 2024-2025, when shopping in Chile became attractive, and fall in 2018-2019 and in 2026. The ranking with all countries is in foreign tourists in Chile by country.
Argentine tourists in Chile in 2026, month by month
| Month | 2026 | 2025 | Change | % of the month's tourists (2026) |
|---|---|---|---|---|
| January | 369,830 | 517,976 | -28.6% | 52.1% |
| February | 239,262 | 393,021 | -39.1% | 47.1% |
| March | 152,573 | 284,115 | -46.3% | 34.2% |
| April | 133,342 | 257,386 | -48.2% | 38.7% |
| May | 108,593 | 191,511 | -43.3% | 39.1% |
| June | 74,391 | 107,649 | -30.9% | 28.0% |
| July | 86,633 | 179,925 | -51.9% | 21.1% |
| August | 62,054 | 145,854 | -57.5% | 18.0% |
| January to August | 1,226,678 | 2,077,437 | -41.0% | 37.1% |
Source: Subturismo and Sernatur, October 2026 release. Changes and shares: Viajando Chile's calculation. The decline deepens month after month: in August it reached 57.5%, and that month fewer Argentines than Brazilians (116,709) arrived, as we reported in the August story. The month with the most Argentines in the whole series was January 2017, with 647,955.

Where Argentine tourists enter Chile
| Entry point | 2026 (January to August) | % 2026 | 2025 | % 2025 |
|---|---|---|---|---|
| Cristo Redentor system (Los Libertadores) | 371,212 | 30.3% | 1,017,705 | 35.6% |
| Arturo Merino Benítez Airport (Santiago) | 231,424 | 18.9% | 425,308 | 14.9% |
| Cardenal Antonio Samoré | 139,406 | 11.4% | 355,014 | 12.4% |
| Puesco (Mamuil Malal) | 75,118 | 6.1% | 160,741 | 5.6% |
| Pino Hachado | 67,587 | 5.5% | 183,433 | 6.4% |
| Dorotea | 59,351 | 4.8% | 104,806 | 3.7% |
| Integración Austral (Monte Aymond) | 41,667 | 3.4% | 83,829 | 2.9% |
Source: Subturismo and Sernatur, "Consulta desagregada" sheet (Argentine nationality). Viajando Chile's calculation. Four in five Argentines arrive overland, mainly via Cristo Redentor, which links Mendoza with Los Andes. That is why snow closures weigh so heavily on the figures, as we saw in the border crossings with the most tourists.
Does your hotel, store or agency welcome Argentine tourists? Reach them while they plan their trip, with Viajando Chile.
See advertising optionsHow much Argentine tourists spend in Chile
| Indicator (2023) | Argentine tourist | Average of all tourists |
|---|---|---|
| Total spending per tourist | US$270 | US$637 |
| Daily spending | US$37.2 | US$47.2 |
| Nights stayed | 7.3 | 13.5 |
| Total foreign exchange | US$370.0 million (15.6%) | US$2,374.8 million |
Source: Sernatur, inbound tourism tables, 2023. Argentines spend less per person than average, because many come for a few days and overland, but thanks to their numbers they leave almost as much as Brazilians. More detail in how much foreign tourists spend in Chile and Brazilian tourists in Chile.
Frequently asked questions
How many Argentine tourists visit Chile each year?
In 2025, 2,856,441 arrived, 47.6% of all foreign tourists. Between January and August 2026, 1,226,678 arrived.
What was the record year for Argentines in Chile?
2017, with 3,323,771 Argentine tourists.
How much did Argentine arrivals fall in 2026?
41.0% from January to August compared with the same period of 2025. In August the drop was 57.5%.
Where do most Argentines enter Chile?
Through the Cristo Redentor system: 30.3% of Argentines in 2026, followed by Santiago airport (18.9%).
How to cite this data
Viajando Chile (2026). *Argentine tourists in Chile 2026: 1,226,678 arrivals through August, 41% fewer than in 2025*. With data from Chile's Undersecretariat of Tourism and Sernatur. Available at: https://viajandochile.com/en/news/argentine-tourists-in-chile-statistics