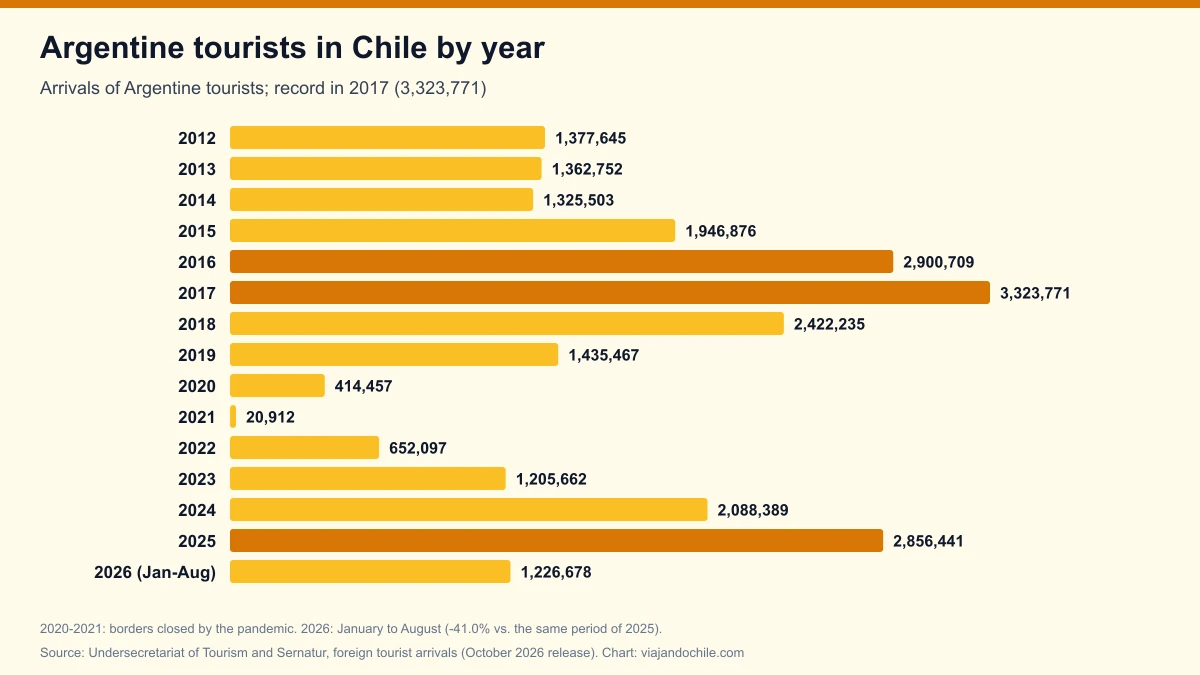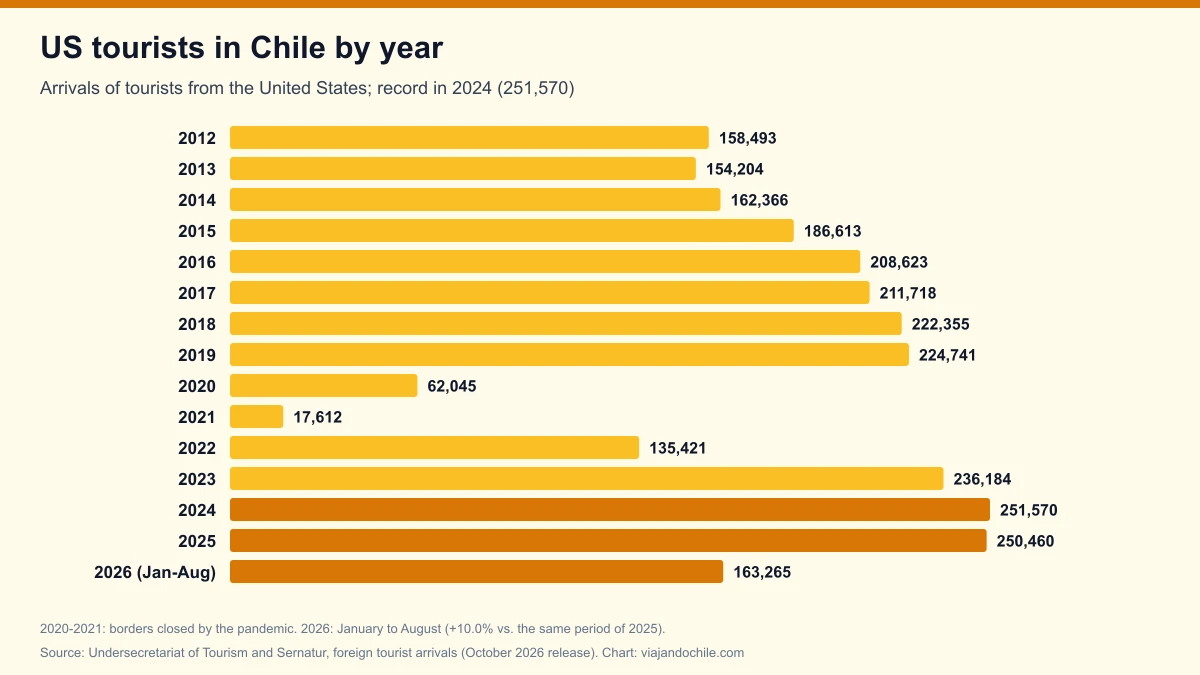
Between January and August 2026, 163,265 tourists from the United States arrived in Chile, 10.0% more than in the same period of 2025 (148,388), in a year when total foreign arrivals are down 19.1%. The United States is Chile's fifth-largest market, behind Argentina, Brazil, Bolivia and Peru, and the largest outside South America, according to the foreign tourist arrivals data of Chile's Undersecretariat of Tourism and Sernatur, compiled from Investigations Police (PDI) records.
*Updated October 30, 2026, with the October 2026 release (data through August 2026).* Figures refer to tourists of US nationality and exclude entries through seaports, such as cruise passengers. Figures from 2020 onward are preliminary.
US tourists in Chile by year
| Year | US tourists | % of all tourists |
|---|---|---|
| 2008 | 168,548 | 6.2% |
| 2012 | 158,493 | 4.5% |
| 2015 | 186,613 | 4.2% |
| 2016 | 208,623 | 3.7% |
| 2017 | 211,718 | 3.3% |
| 2018 | 222,355 | 3.9% |
| 2019 | 224,741 | 5.0% |
| 2020 | 62,045 | 5.5% |
| 2021 | 17,612 | 9.3% |
| 2022 | 135,421 | 6.7% |
| 2023 | 236,184 | 6.3% |
| 2024 | 251,570 | 4.8% |
| 2025 | 250,460 | 4.2% |
| 2026 (January to August) | 163,265 | 4.9% |
Source: Undersecretariat of Tourism and Sernatur, "Cuadro por Nacionalidad" sheet. Percentages: Viajando Chile's calculation. The annual record is 2024, with 251,570 US tourists, just above 2025 (250,460). If the last four months of 2026 match 2025 (102,072 arrivals), the year would close at about 265,000 and set a new record; this is our projection, not official data.
Unlike Argentine arrivals, which swing with the exchange rate, the US series is stable: between 150,000 and 225,000 a year before the pandemic and above 230,000 since 2023. Other countries are in foreign tourists in Chile by country.
US tourists in Chile in 2026, month by month
| Month | 2026 | 2025 | Change | % of the month's tourists (2026) |
|---|---|---|---|---|
| January | 36,991 | 31,351 | +18.0% | 5.2% |
| February | 30,796 | 27,664 | +11.3% | 6.1% |
| March | 33,077 | 29,915 | +10.6% | 7.4% |
| April | 15,409 | 14,111 | +9.2% | 4.5% |
| May | 10,649 | 10,766 | -1.1% | 3.8% |
| June | 9,861 | 8,923 | +10.5% | 3.7% |
| July | 11,809 | 12,311 | -4.1% | 2.9% |
| August | 14,673 | 13,347 | +9.9% | 4.3% |
| January to August | 163,265 | 148,388 | +10.0% | 4.9% |
Source: Subturismo and Sernatur. Viajando Chile's calculation. Americans travel during the southern summer, which coincides with their winter: the month with the most US tourists in the whole series was December 2025, with 43,699. From September to December 2025, 102,072 arrived, 40.8% of the year.
Where US tourists enter Chile
| Entry point | 2026 (January to August) | % 2026 | 2025 | % 2025 |
|---|---|---|---|---|
| Arturo Merino Benítez Airport (Santiago) | 141,157 | 86.5% | 217,048 | 86.7% |
| Río Don Guillermo (Cerro Castillo, Magallanes) | 7,763 | 4.8% | 12,531 | 5.0% |
| Laurita Casas Viejas (Magallanes) | 2,273 | 1.4% | 2,781 | 1.1% |
| Cardenal Antonio Samoré | 1,821 | 1.1% | 3,031 | 1.2% |
| Cristo Redentor system | 1,577 | 1.0% | 3,130 | 1.2% |
| Hito Cajón | 1,302 | 0.8% | 1,539 | 0.6% |
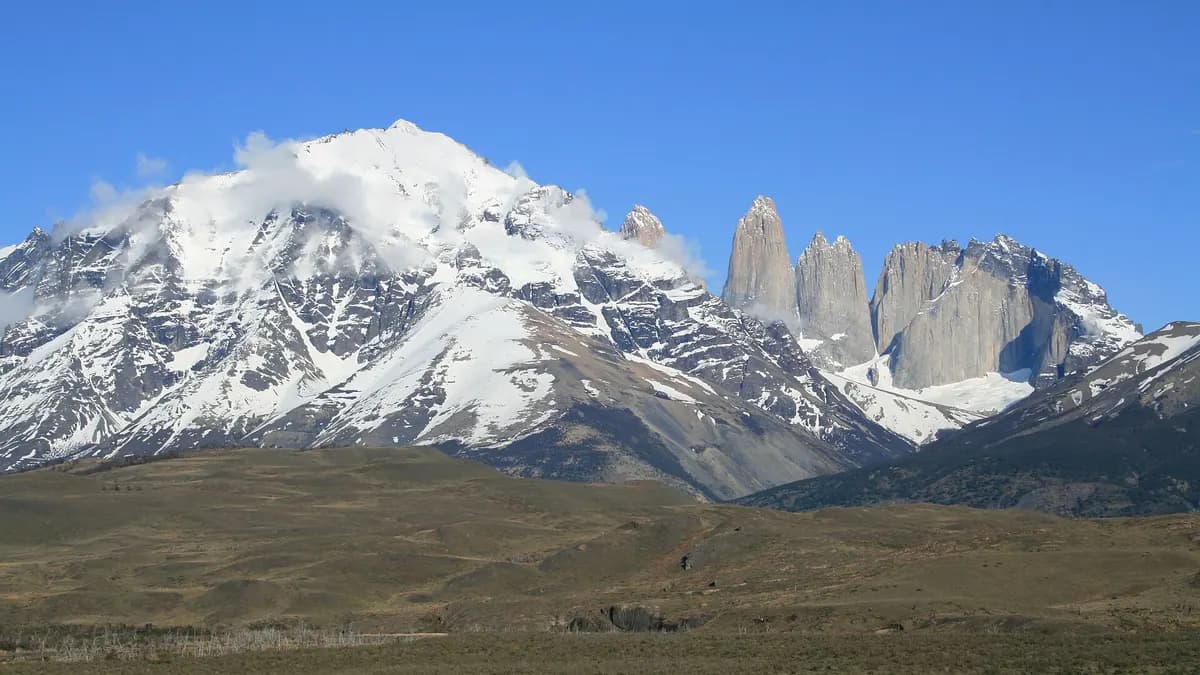
Source: Subturismo and Sernatur, "Consulta desagregada" sheet (US nationality). Viajando Chile's calculation. 86.5% enter through Santiago airport. The Magallanes crossings, such as Río Don Guillermo, reflect travelers who combine Torres del Paine with El Calafate in Argentina. Air links with North America are recovering this season, with United's return, as we reported in the routes returning to Santiago airport.
Does your hotel, winery or agency welcome travelers from the United States? Reach them in English, with Viajando Chile.
See advertising optionsHow much US tourists spend in Chile
| Indicator (2023) | US tourist | Average of all tourists |
|---|---|---|
| Total spending per tourist | US$1,311 | US$637 |
| Daily spending | US$96.8 | US$47.2 |
| Nights stayed | 13.5 | 13.5 |
| Total foreign exchange | US$329.2 million (13.9%) | US$2,374.8 million |
Source: Sernatur, inbound tourism tables, 2023. With less than 5% of tourists, the United States contributed 13.9% of foreign exchange: each American spends more than twice the average. It was the third country by foreign exchange in 2023, after Brazil and Argentina, according to how much foreign tourists spend in Chile. In the other direction, Chileans travel visa-free to the US under the Visa Waiver Program, whose overstay rate we review in this story.
Frequently asked questions
How many US tourists visit Chile each year?
In 2025, 250,460 arrived. The record is 2024, with 251,570. Between January and August 2026, 163,265 arrived, 10.0% more than a year earlier.
Where does the United States rank among countries visiting Chile?
Fifth, behind Argentina, Brazil, Bolivia and Peru, and first outside South America.
In which month do most Americans arrive?
December and January. The monthly record is December 2025, with 43,699.
How much does a US tourist spend in Chile?
US$1,311 per trip and US$96.8 per day in 2023, according to Sernatur.
How to cite this data
Viajando Chile (2026). *US tourists in Chile 2026: 163,265 arrivals through August, up 10% and heading for a record*. With data from Chile's Undersecretariat of Tourism and Sernatur. Available at: https://viajandochile.com/en/news/us-tourists-in-chile-statistics