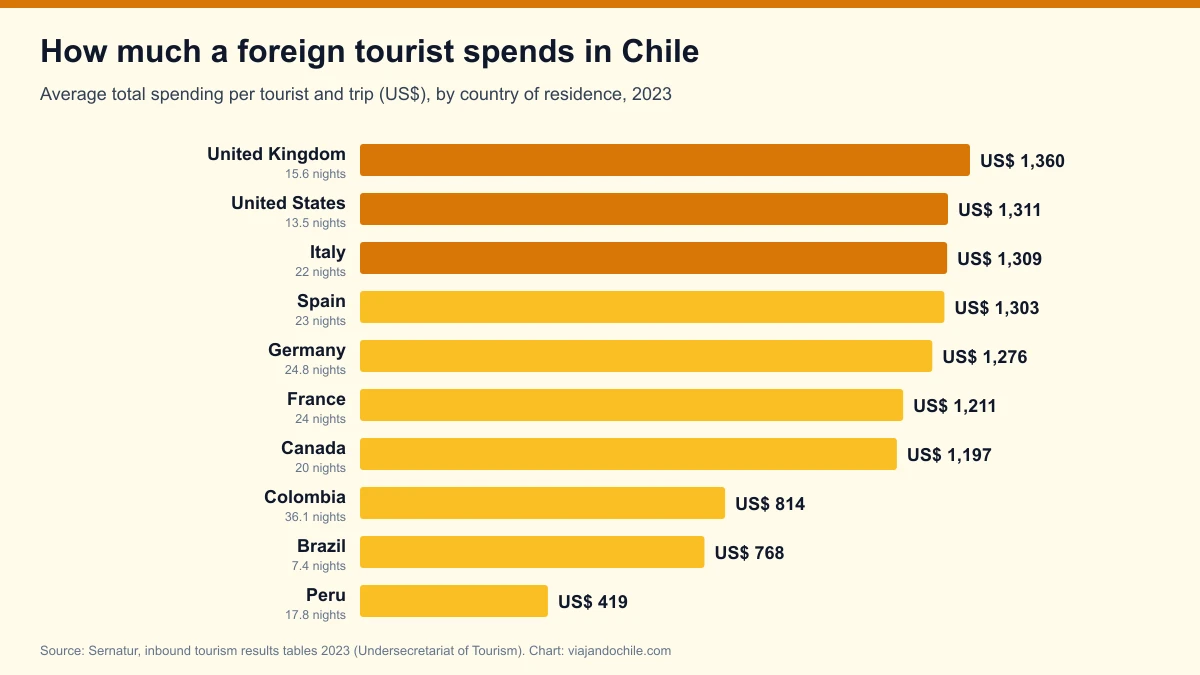
A tourist from the United Kingdom spends an average of US$1,360 per trip in Chile, five times as much as one from Argentina (US$270), according to the latest complete annual inbound tourism tables from Sernatur, Chile's tourism board, with 2023 data. Europeans and North Americans stay more nights and spend more in total; Brazilians spend the most per day, at US$103, and Argentines and Brazilians bring in the most foreign currency overall because of their numbers.
*Updated on October 22, 2026.* The data come from the inbound tourism results tables published by the Undersecretariat of Tourism and compiled by Sernatur's Statistics Department. 2023 is the latest year with full annual detail by country; for 2024 there is country detail only for the third and fourth quarters, which we also include.
Ranking: how much foreign tourists spend in Chile per trip
| # | Country of residence | Total spending per tourist (US$) | Daily spending (US$) | Average nights |
|---|---|---|---|---|
| 1 | United Kingdom (England in the spreadsheet) | 1,360 | 87.3 | 15.6 |
| 2 | United States | 1,311 | 96.8 | 13.5 |
| 3 | Italy | 1,309 | 59.5 | 22.0 |
| 4 | Spain | 1,303 | 56.6 | 23.0 |
| 5 | Germany | 1,276 | 51.5 | 24.8 |
| 6 | France | 1,211 | 50.5 | 24.0 |
| 7 | Canada | 1,197 | 59.7 | 20.0 |
| 8 | Colombia | 814 | 22.5 | 36.1 |
| 9 | Brazil | 768 | 103.3 | 7.4 |
| 10 | Peru | 419 | 23.5 | 17.8 |
| 11 | Argentina | 270 | 37.2 | 7.3 |
| — | Average for all tourists | 637 | 47.2 | 13.5 |
Source: Sernatur, inbound tourism results tables, 2023 (Table 2, by country of residence), published by the Undersecretariat of Tourism. The aggregated categories "other Americas", "other Europe" and "rest of the world" are excluded. Figures in current US dollars, rounded.
Who brings the most foreign currency to Chile
Spending per person is not the same as total contribution. Argentina and Brazil lead foreign-exchange income because they send many more tourists, even if each spends less. In 2023, foreign tourists spent a total of US$2,374.8 million in Chile, excluding international transport.
| Country of residence | Tourists (2023) | Foreign exchange (US$ million) | Share |
|---|---|---|---|
| Brazil | 486,959 | 373.8 | 15.7% |
| Argentina | 1,370,645 | 370.0 | 15.6% |
| United States | 251,023 | 329.2 | 13.9% |
| Peru | 321,534 | 134.9 | 5.7% |
| Colombia | 141,257 | 114.9 | 4.8% |
| Spain | 77,454 | 100.9 | 4.2% |
| Germany | 72,041 | 91.9 | 3.9% |
| France | 69,129 | 83.7 | 3.5% |
| United Kingdom | 56,787 | 77.2 | 3.3% |
| Canada | 52,005 | 62.2 | 2.6% |
| Total tourists | 3,730,507 | 2,374.8 | 100% |
Source: Sernatur, inbound tourism 2023. Shares calculated by Viajando Chile on total tourist foreign-exchange income. The survey measures residents abroad entering for tourism purposes, so its total is lower than the tourist arrivals figure reported by Chile's police (PDI).
Foreign tourist spending in Chile with the latest data
In 2024, spending per tourist rose in almost every market. In the fourth quarter, the latest with country detail, a US tourist spent an average of US$118 a day and a British one US$107. Argentines, who numbered 741,681 that quarter, spent US$53 a day and US$281 per trip.
| Country of residence | Daily spending (US$) | Total spending per tourist (US$) | Nights |
|---|---|---|---|
| United States | 118.3 | 1,381 | 11.7 |
| United Kingdom | 106.5 | 1,430 | 13.4 |
| Canada | 99.7 | 1,372 | 13.8 |
| Brazil | 98.6 | 675 | 6.8 |
| Spain | 74.3 | 1,304 | 17.5 |
| Italy | 74.1 | 1,248 | 16.8 |
| Germany | 68.0 | 1,411 | 20.8 |
| France | 57.6 | 1,278 | 22.2 |
| Argentina | 53.4 | 281 | 5.3 |
| Peru | 36.7 | 445 | 12.1 |
| Colombia | 35.6 | 737 | 20.7 |
| Average | 56.2 | 586 | 10.4 |
Source: Sernatur, 2024 annual inbound tourism tables (fourth quarter, provisional figures). In all of 2024, 5,239,233 tourists arrived for tourism purposes and spent US$3,118.4 million; adding same-day visitors and international transport, income was US$3,619.4 million.
Does your hotel, agency or restaurant want to reach the tourists who spend the most in Chile?
See advertising optionsWhat explains the spending gap between countries
- Distance: visitors from Europe or North America make longer trips, of two to three weeks, and combine several destinations, such as Patagonia and the Atacama Desert.
- Daily spending: Brazilians make short trips of about a week, but spend a lot per day on hotels, ski resorts and tours; in 2026 they already outnumber Argentines in arrivals, as shown by August arrivals.
- Short-distance trips: Argentines and Peruvians often come overland, to shop, visit family or for a few days, and spend less per trip.
- Exchange rates: spending in dollars rises or falls with the strength of the home currency against the Chilean peso.

How much foreign tourism brought in 2025
Sernatur has not yet published the 2025 tables by country, but in its 2026 public accounts report it reported that inbound tourism revenue reached US$4,157 million in 2025, up 14.9% on 2024, with 6 million international arrivals. We will update this ranking on this same page when the country data are released. The debate on how much to invest in attracting these visitors is part of Chile's 2027 tourism budget.
How to cite this data
Viajando Chile (2026). *How much foreign tourists spend in Chile by country: Sernatur's official ranking*. With data from Sernatur and the Undersecretariat of Tourism. https://viajandochile.com/en/news/how-much-foreign-tourists-spend-in-chile-by-country
Frequently asked questions
How much does a foreign tourist spend in Chile on average?
US$637 per trip and US$47 per day in 2023, with an average stay of 13.5 nights, according to Sernatur. In the fourth quarter of 2024, the average was US$586 per trip and US$56 per day.
Which tourists spend the most in Chile?
Per trip, those from the United Kingdom, the United States, Italy and Spain, all above US$1,300. Per day, those from Brazil and the United States.
Which country brings the most foreign currency to Chile?
In 2023, Brazil (US$373.8 million), closely followed by Argentina (US$370.0 million) and the United States (US$329.2 million).