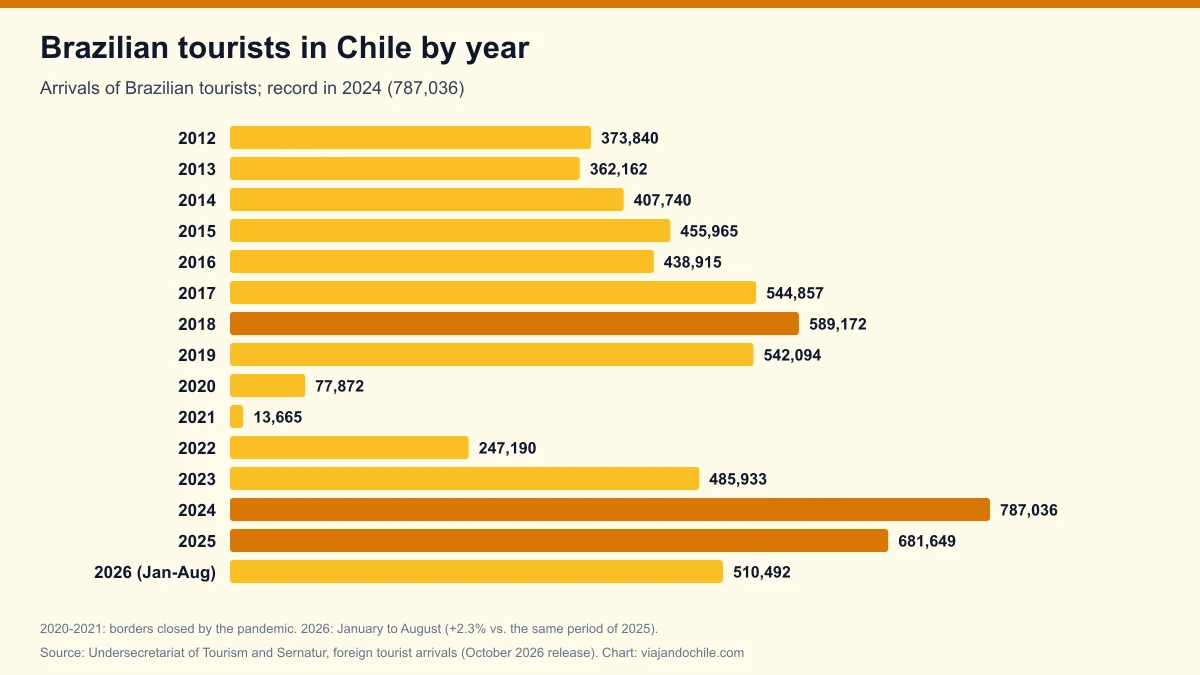
Between January and August 2026, 510,492 Brazilian tourists arrived in Chile, 2.3% more than in the same period of 2025, in a year when total foreign tourist arrivals are down 19.1%. Brazil is the country's second-largest market, behind Argentina, and July 2026 was the month with the most Brazilians in the whole series: 152,265, according to the foreign tourist arrivals data from the Undersecretariat of Tourism and Sernatur, compiled with figures from the Investigations Police (PDI).
*Updated October 29, 2026, with the October 2026 release (data through August 2026).* The figures refer to tourists of Brazilian nationality and exclude entries through seaports. Figures from 2020 onward are preliminary.
Brazilian tourists in Chile by year
| Year | Brazilian tourists | % of all tourists | Rank among countries |
|---|---|---|---|
| 2015 | 455,965 | 10.2% | 2 |
| 2016 | 438,915 | 7.8% | 2 |
| 2017 | 544,857 | 8.4% | 2 |
| 2018 | 589,172 | 10.3% | 2 |
| 2019 | 542,094 | 12.0% | 2 |
| 2020 | 77,872 | 7.0% | 4 |
| 2021 | 13,665 | 7.2% | 6 |
| 2022 | 247,190 | 12.2% | 2 |
| 2023 | 485,933 | 13.0% | 2 |
| 2024 | 787,036 | 15.0% | 2 |
| 2025 | 681,649 | 11.4% | 2 |
| 2026 (January to August) | 510,492 | 15.4% | 2 |
Source: Undersecretariat of Tourism and Sernatur, "Cuadro por Nacionalidad" sheet. Percentages and ranks: Viajando Chile calculation. The annual record is 2024, with 787,036 Brazilians. The series starts in 2008, with 252,973. In 2020 and 2021 the borders were closed for much of the year because of the pandemic.
In 2025, 681,649 Brazilians arrived, 11.4% of the year's 6,004,567 tourists. Argentina was first, with 2,856,441, and Bolivia third, with 562,729. Brazil has ranked second every year since 2014, except during the pandemic. Details for other countries are in foreign tourists in Chile by country.
Brazilian tourists in Chile in 2026, month by month
| Month | 2026 | 2025 | Change | % of the month's tourists (2026) |
|---|---|---|---|---|
| January | 46,428 | 53,230 | -12.8% | 6.5% |
| February | 26,027 | 23,511 | +10.7% | 5.1% |
| March | 32,697 | 35,189 | -7.1% | 7.3% |
| April | 37,314 | 35,684 | +4.6% | 10.8% |
| May | 34,255 | 36,700 | -6.7% | 12.3% |
| June | 64,797 | 66,896 | -3.1% | 24.4% |
| July | 152,265 | 141,993 | +7.2% | 37.1% |
| August | 116,709 | 105,943 | +10.2% | 33.8% |
| January to August | 510,492 | 499,146 | +2.3% | 15.4% |
Source: Subturismo and Sernatur, October 2026 release. Changes and shares: Viajando Chile calculation. In July and August 2026 more Brazilians arrived than Argentines (86,633 and 62,054 Argentines, respectively), as we reported in our story on August.

When Brazilians travel to Chile
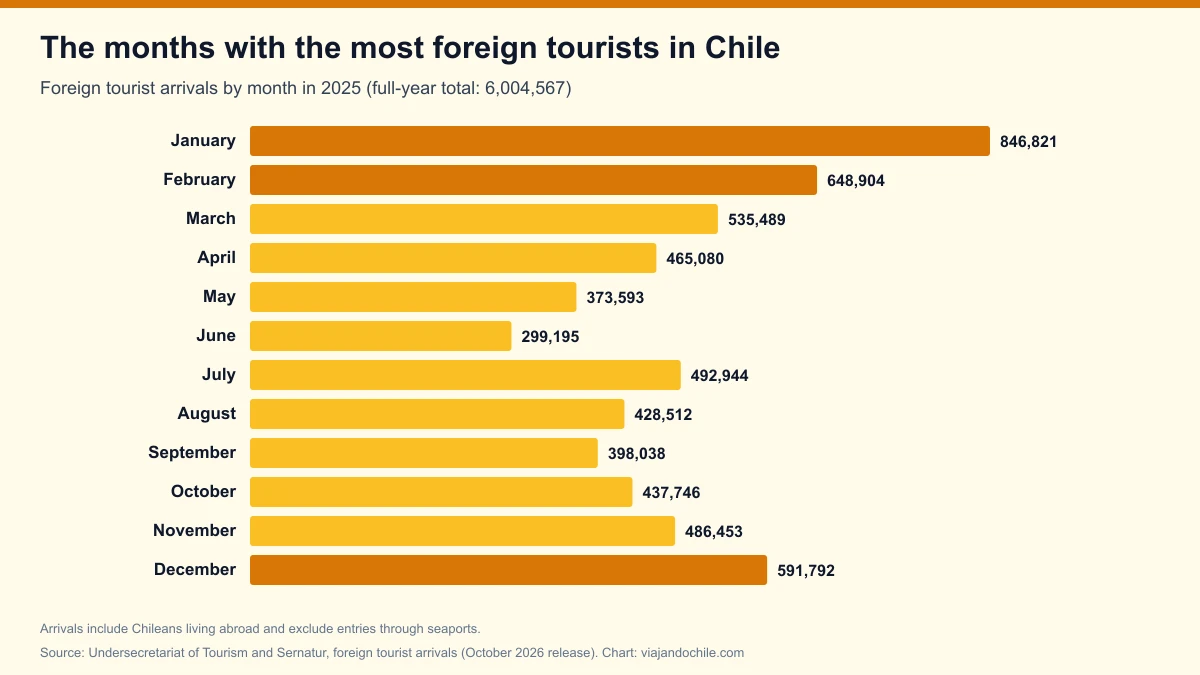
Brazilians come mostly in winter. In 2025, July accounted for 20.8% of the year's Brazilian visitors and August for 15.5%: more than a third arrived in those two months, during the ski season. It is the opposite pattern to Argentines, who come in summer, as shown in the months with the most foreign tourists and in the snow season in Chile.
Does your hotel, ski resort or agency welcome Brazilians? Reach them in Portuguese, right when they are planning their trip.
See advertising optionsWhere Brazilian tourists enter Chile: the airport and border crossings
| Point of entry | 2026 (January to August) | 2025 |
|---|---|---|
| Arturo Merino Benítez Airport (Santiago) | 451,930 | 589,241 |
| Cristo Redentor system (Los Libertadores) | 9,946 | 17,812 |
| Jama | 9,081 | 14,548 |
| Hito Cajón | 8,018 | 12,203 |
| San Sebastián | 5,299 | 8,671 |
| Cardenal Antonio Samoré | 4,778 | 6,629 |
| Integración Austral (Monte Aymond) | 4,128 | 7,250 |
| Total | 510,492 | 681,649 |
Source: Subturismo and Sernatur, "Consulta desagregada" sheet (Brazilian nationality). 88.5% of 2026's Brazilian visitors entered through Santiago airport (86.4% in 2025). The rest arrive overland, on trips combining Chile with Argentina or Bolivia: through the northern crossings toward San Pedro de Atacama and through those in Magallanes, bound for Patagonia.
How much Brazilian tourists spend in Chile
| Indicator (2023) | Brazilian tourist | Average of all tourists |
|---|---|---|
| Total spending per tourist | US$768 | US$637 |
| Daily spending | US$103.3 | US$47.2 |
| Nights stayed | 7.4 | 13.5 |
| Total foreign currency | US$373.8 million (15.7%) | US$2,374.8 million |
Source: Sernatur, inbound tourism results tables, 2023. In 2023 Brazil was the country that brought the most foreign currency into Chile, just ahead of Argentina (US$370.0 million): its tourists stay fewer nights but spend more than twice the average per day. More detail in how much foreign tourists spend in Chile.
One thing to watch: after Brazil's election, the real fell 8.85% against the Chilean peso on Monday, October 26, 2026, closing at 182.67 pesos, according to La Tercera, which makes Chile more expensive for Brazilians. We explain it in what the fall of the real changes for Brazilian tourists.
Frequently asked questions
How many Brazilian tourists visit Chile each year?
In 2025, 681,649 arrived. The record is 2024, with 787,036. Between January and August 2026, 510,492 arrived.
Where does Brazil rank among the countries that visit Chile?
Second, behind Argentina. In 2026 it accounts for 15.4% of arrivals through August.
In which month do the most Brazilians arrive in Chile?
July. In July 2026, 152,265 arrived, the highest monthly figure since the series began in 2008.
How do Brazilians enter Chile?
Almost all by air: 88.5% of 2026's Brazilian visitors arrived through Arturo Merino Benítez Airport in Santiago.
How to cite this data
Viajando Chile (2026). *Brazilian tourists in Chile 2026: 510,492 arrivals through August and a monthly record in July*. Based on data from the Undersecretariat of Tourism and Sernatur. Available at: https://viajandochile.com/en/news/brazilian-tourists-in-chile-statistics