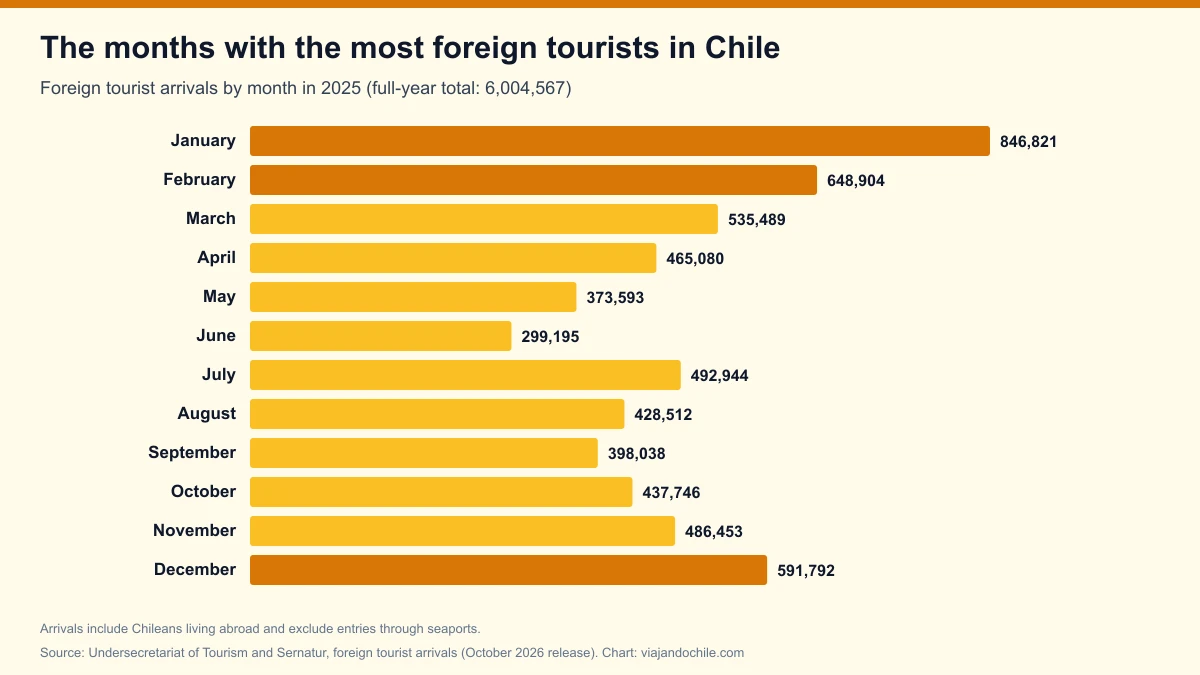
January is the month when the most foreign tourists arrive in Chile: in 2025 there were 846,821, or 14.1% of the year's 6,004,567, while June was the lowest, with 299,195 (5.0%). January was the month with the most arrivals in 14 of the 18 years between 2008 and 2025, according to the official foreign tourist arrivals series from Chile's Undersecretariat of Tourism and Sernatur, compiled with data from the Investigations Police (PDI).
*Updated October 28, 2026, with the October 2026 release (data through August 2026).* The figures include Chileans living abroad and exclude entries through seaports, according to the spreadsheet's own notes. Figures from 2020 onward are preliminary.
Foreign tourists in Chile by month in 2025
| Month | 2025 arrivals | % of year | Rank |
|---|---|---|---|
| January | 846,821 | 14.1% | 1 |
| February | 648,904 | 10.8% | 2 |
| March | 535,489 | 8.9% | 4 |
| April | 465,080 | 7.7% | 7 |
| May | 373,593 | 6.2% | 11 |
| June | 299,195 | 5.0% | 12 |
| July | 492,944 | 8.2% | 5 |
| August | 428,512 | 7.1% | 9 |
| September | 398,038 | 6.6% | 10 |
| October | 437,746 | 7.3% | 8 |
| November | 486,453 | 8.1% | 6 |
| December | 591,792 | 9.9% | 3 |
| Total 2025 | 6,004,567 | 100% |
Source: Undersecretariat of Tourism and Sernatur, "Cuadro por Nacionalidad" sheet, Total general row. Percentages and ranks: Viajando Chile calculation. Summer (December to February) accounted for 34.8% of 2025 arrivals.
The months with the most foreign tourists, year by year
The pattern repeats: January leads and June is the quietest month. To avoid distorting the average with the pandemic, the table below excludes 2020 and 2021, when borders were closed for much of the year.
| Month | Average share (2015-2019 and 2022-2025) |
|---|---|
| January | 12.2% |
| December | 11.9% |
| February | 9.4% |
| November | 9.0% |
| March | 8.4% |
| October | 8.3% |
| July | 7.9% |
| August | 7.2% |
| April | 7.1% |
| September | 7.1% |
| May | 6.0% |
| June | 5.6% |
Source: Viajando Chile calculation with the Undersecretariat of Tourism and Sernatur series. January was the month with the most arrivals in 14 years; December beat it in 2015, 2021, 2022 and 2024. The busiest month in the whole series was January 2017, with 964,027 arrivals, in the record year of 6,449,883 tourists, as we show in foreign tourist arrivals by year.

Where tourists come from each month
| Month (2025) | Argentina | Brazil | Europe | North America |
|---|---|---|---|---|
| January | 517,976 | 53,230 | 60,107 | 43,133 |
| February | 393,021 | 23,511 | 52,323 | 37,888 |
| March | 284,115 | 35,189 | 43,962 | 40,251 |
| April | 257,386 | 35,684 | 33,078 | 20,929 |
| May | 191,511 | 36,700 | 20,358 | 16,033 |
| June | 107,649 | 66,896 | 15,081 | 12,968 |
| July | 179,925 | 141,993 | 21,023 | 18,569 |
| August | 145,854 | 105,943 | 25,038 | 20,255 |
| September | 165,291 | 57,257 | 25,361 | 19,048 |
| October | 179,852 | 41,758 | 40,028 | 28,195 |
| November | 193,269 | 36,497 | 61,157 | 40,462 |
| December | 240,592 | 46,991 | 63,162 | 58,305 |
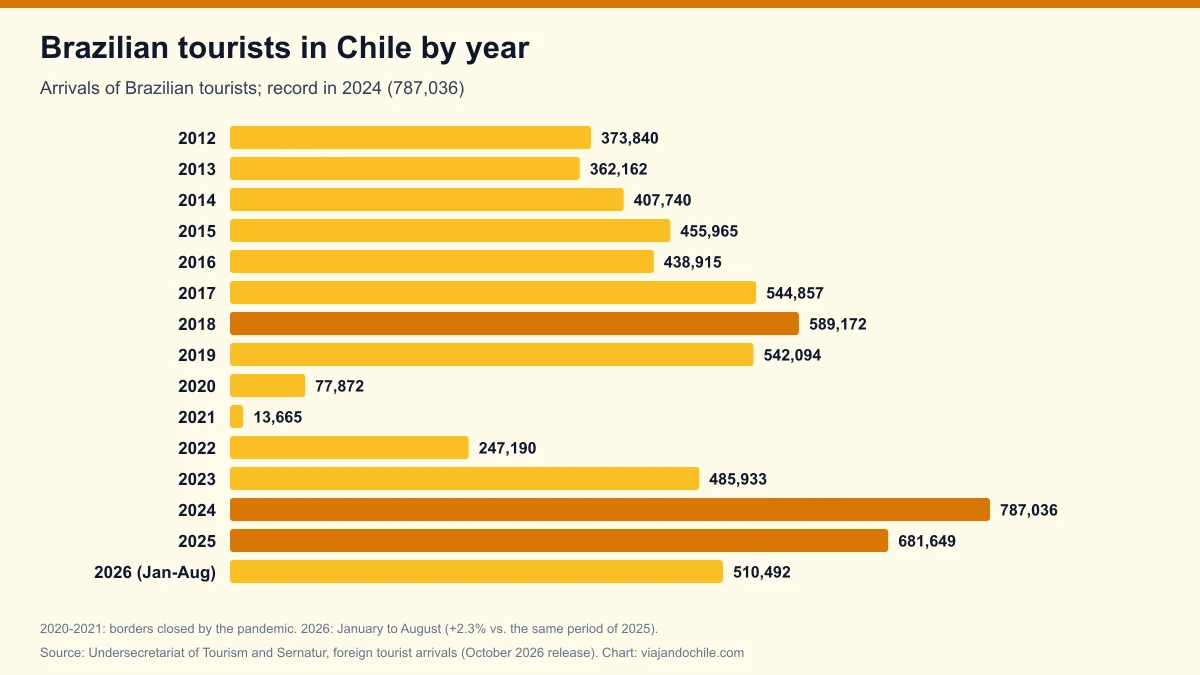
Source: Undersecretariat of Tourism and Sernatur, "Cuadro por Nacionalidad". Three different seasons: Argentines come mostly in summer (in January 2025 they were 61% of all tourists who entered); Brazilians in winter, peaking in July (141,993), drawn by the snow, as we explain in when is ski season in Chile; and Europeans and North Americans between November and January, when it is summer in the south and the best time for Patagonia.
Does your business depend on the season? Advertise in the month your customers plan their trip, in four languages.
See advertising optionsThe months with the most foreign tourists in 2026: all down
| Month | 2026 arrivals | 2025 arrivals | Change |
|---|---|---|---|
| January | 710,346 | 846,821 | -16.1% |
| February | 508,281 | 648,904 | -21.7% |
| March | 446,702 | 535,489 | -16.6% |
| April | 344,615 | 465,080 | -25.9% |
| May | 277,915 | 373,593 | -25.6% |
| June | 265,864 | 299,195 | -11.1% |
| July | 410,213 | 492,944 | -16.8% |
| August | 344,937 | 428,512 | -19.5% |
| January to August | 3,308,873 | 4,090,538 | -19.1% |
Source: Undersecretariat of Tourism and Sernatur, October 2026 release. In 2026, January is still the month with the most tourists, but every reported month is down on 2025, mainly because of fewer Argentines. See the breakdown by country in foreign tourists in Chile by country 2026 and the August case, when Brazil overtook Argentina.

The record for each month
2017 is still the benchmark year: it holds the arrivals record in 9 of the 12 months. Only March (2018), May and July (both 2025) peaked in another year.
| Month | Record arrivals | Record year |
|---|---|---|
| January | 964,027 | 2017 |
| February | 709,043 | 2017 |
| March | 574,260 | 2018 |
| April | 469,626 | 2017 |
| May | 373,593 | 2025 |
| June | 322,568 | 2017 |
| July | 492,944 | 2025 |
| August | 480,158 | 2017 |
| September | 442,503 | 2017 |
| October | 481,782 | 2017 |
| November | 517,243 | 2017 |
| December | 692,690 | 2017 |
Source: Viajando Chile calculation with the 2008-2026 monthly series from the Undersecretariat of Tourism and Sernatur. In July 2025, 141,993 Brazilians arrived, the highest figure for that country in any month of that year.
What it means for travelers to Chile
- January and February are the busiest months: more foreign tourists plus Chileans' own vacations. Book ahead in Patagonia, on the coast and in the south.
- May, June and September are the quietest, except at ski resorts, which fill up in July and August.
- October, November and March combine good weather in much of the country with fewer people. See our guide on when to visit Chile.
Frequently asked questions
Which month do most tourists arrive in Chile?
January. In 2025, 846,821 foreign tourists arrived, 14.1% of the annual total.
Which month has the fewest tourists?
June. In 2025, 299,195 arrived, 5.0% of the year.
When do most Brazilians come?
In July, for the snow season: 141,993 Brazilians arrived in July 2025, more than in any other month.
How to cite this data
Viajando Chile (2026). *The months with the most foreign tourists in Chile in 2025: January leads with 846,821 arrivals and June is the lowest*. Based on data from the Undersecretariat of Tourism and Sernatur. Available at: https://viajandochile.com/en/news/months-with-most-foreign-tourists-in-chile