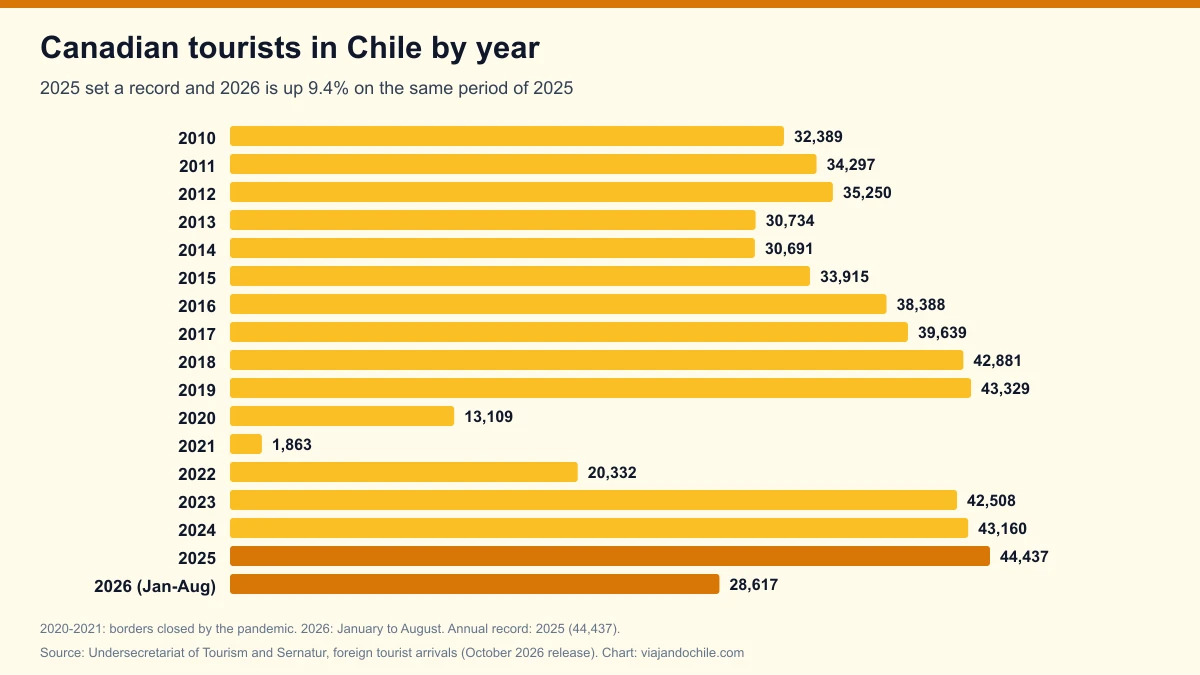
In 2025, 44,437 Canadian tourists arrived in Chile, the highest figure since 2008, and between January and August 2026 there were already 28,617, 9.4% more than in the same period the year before (26,169). The data come from the foreign tourist arrivals published by Chile's Undersecretariat of Tourism and Sernatur, based on Investigations Police records. If the pace holds, 2026 would set a new record. January (7,435) and February (6,756) 2026 were the highest in the series for those months.
*Updated on 7 November 2026, with the October 2026 release (data to August 2026).* Figures exclude arrivals by sea port and are preliminary since 2020.
View the data as a table
| January to August 2026 | 28,617 |
| Full year 2025 | 44,437 |
| January 2026 | 7,435 |
Canadian tourists in Chile by year
Canada is a small but stable market: between 30,000 and 43,000 arrivals a year up to 2019. After falling to 1,863 in 2021, it recovered faster than most long-haul markets and in 2025 beat its 2019 level (43,329) for the first time.
| Year | Canadian tourists | Year | Canadian tourists |
|---|---|---|---|
| 2008 | 36,981 | 2017 | 39,639 |
| 2009 | 34,574 | 2018 | 42,881 |
| 2010 | 32,389 | 2019 | 43,329 |
| 2011 | 34,297 | 2020 | 13,109 |
| 2012 | 35,250 | 2021 | 1,863 |
| 2013 | 30,734 | 2022 | 20,332 |
| 2014 | 30,691 | 2023 | 42,508 |
| 2015 | 33,915 | 2024 | 43,160 |
| 2016 | 38,388 | 2025 | 44,437 (record) |
Source: Undersecretariat of Tourism and Sernatur, "Cuadro por Nacionalidad" sheet. 2026 stands at 28,617 to August.
Canadian tourists in Chile in 2026, month by month
For Canadians, Chile is an escape from the northern winter: January, February, March, November and December account for most trips. In 2025, December (7,311) was the busiest month of the year.
View the data as a table
| 2019 | 2025 | 2026 | |
|---|---|---|---|
| Jan | 6,959 | 6,349 | 7,435 |
| Feb | 5,590 | 6,196 | 6,756 |
| Mar | 6,320 | 5,523 | 5,832 |
| Apr | 2,674 | 2,319 | 2,575 |
| May | 1,939 | 1,548 | 1,634 |
| Jun | 1,663 | 905 | 1,077 |
| Jul | 1,595 | 1,357 | 1,303 |
| Aug | 2,167 | 1,972 | 2,005 |
| Sep | 1,970 | 1,975 | No data |
| Oct | 2,990 | 3,203 | No data |
| Nov | 3,967 | 5,779 | No data |
| Dec | 5,495 | 7,311 | No data |
| Month | 2019 | 2025 | 2026 |
|---|---|---|---|
| January | 6,959 | 6,349 | 7,435 (record for the month) |
| February | 5,590 | 6,196 | 6,756 (record for the month) |
| March | 6,320 | 5,523 | 5,832 |
| April | 2,674 | 2,319 | 2,575 |
| May | 1,939 | 1,548 | 1,634 |
| June | 1,663 | 905 | 1,077 |
| July | 1,595 | 1,357 | 1,303 |
| August | 2,167 | 1,972 | 2,005 |
| September | 1,970 | 1,975 | — |
| October | 2,990 | 3,203 | — |
| November | 3,967 | 5,779 | — |
| December | 5,495 | 7,311 | — |
Source: Undersecretariat of Tourism and Sernatur. For the calendar of all visitors, see the months with the most foreign tourists.
Canadian tourists compared with the US and Mexico
In North America, the United States remains by far the largest source market, with 250,460 tourists in 2025. Canada is third, behind Mexico, but in 2026 it is growing almost as fast as the US and much faster than Mexico. The details are in our fact sheets on American tourists in Chile and Mexican tourists.
| Country | 2025 | Jan-Aug 2026 | 2026 change |
|---|---|---|---|
| United States | 250,460 | 163,265 | +10.0% |
| Mexico | 61,139 | 36,727 | +3.5% |
| Canada | 44,437 | 28,617 | +9.4% |
Source: Undersecretariat of Tourism and Sernatur. In the overall 2025 ranking, Canada was 16th, between Australia and China; the full list is in foreign tourists in Chile by country.
Where Canadian tourists enter Chile
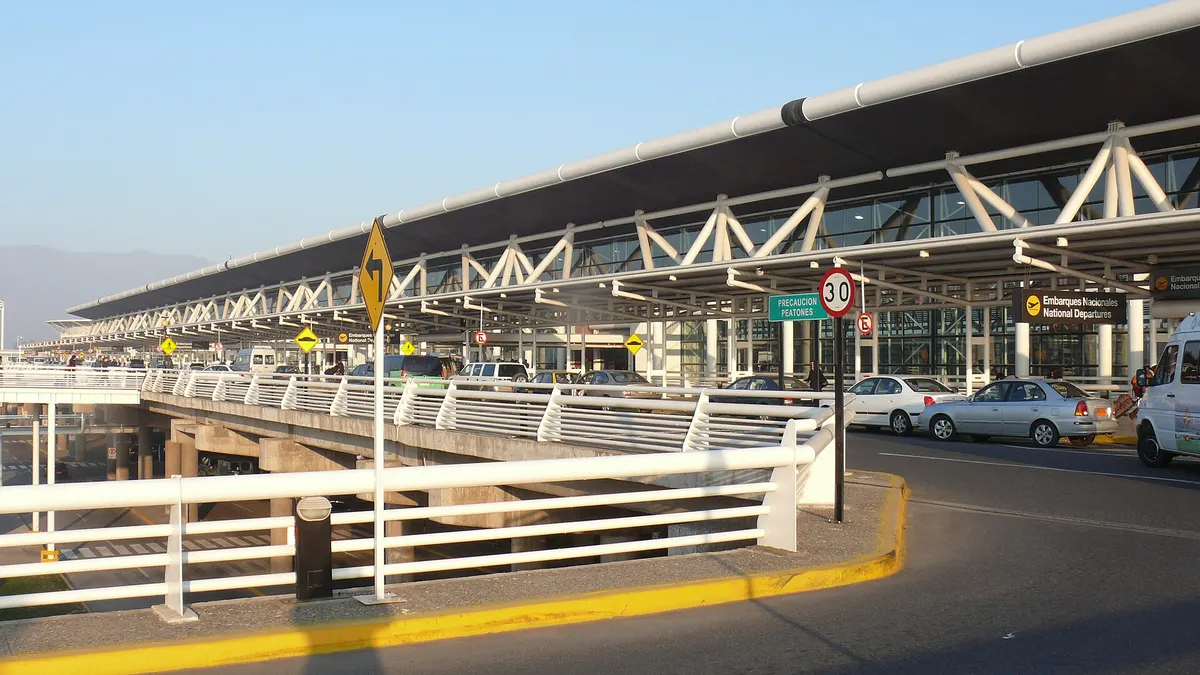
Canadians are among the visitors most likely to fly in: 84% of 2025 arrivals came through an airport, practically all through Santiago (36,902). The most-used land crossings are in Patagonia (Río Don Guillermo and Laurita Casas Viejas, near Puerto Natales) and in the north (Hito Cajón).
View the data as a table
| Airports | Argentine border (as classified) | Northern border | |
|---|---|---|---|
| 2025 | 37,185 | 6,807 | 445 |
| 2026 (Jan-Aug) | 23,846 | 4,377 | 394 |
| Point of entry | 2025 | Jan-Aug 2026 |
|---|---|---|
| Santiago airport | 36,902 | 23,644 |
| Río Don Guillermo | 1,833 | 1,084 |
| Hito Cajón | 973 | 579 |
| Cristo Redentor (Los Libertadores) | 896 | 575 |
| Laurita Casas Viejas | 757 | 640 |
| San Sebastián | 513 | 344 |
| Cardenal Samoré | 419 | 263 |
| Dorotea | 415 | 182 |
| Integración Austral (Monte Aymond) | 245 | Not in the top 10 |
Source: Undersecretariat of Tourism and Sernatur, "CONSULTA_DESAGREGADA" sheet.
By region of entry, Magallanes ranks second (3,956 in 2025), followed by Antofagasta (1,332) and Valparaíso (911). These are the regions of Torres del Paine, San Pedro de Atacama and Valparaíso.
View the data as a table
| Arrivals 2025 | |
|---|---|
| Metropolitana | 36,902 |
| Magallanes | 3,956 |
| Antofagasta | 1,332 |
| Valparaíso | 911 |
| Los Lagos | 626 |
| Arica y Parinacota | 309 |
| La Araucanía | 166 |
| Aysén | 130 |
| Tarapacá | 28 |
| Maule | 25 |
| Coquimbo | 21 |
| Los Ríos | 21 |
| Atacama | 7 |
| Biobío | 3 |
Frequently asked questions
How many Canadian tourists visit Chile each year?
44,437 in 2025, the record since 2008. Between January and August 2026, 28,617 arrived, 9.4% more than in the same period of 2025.
When do Canadians travel to Chile?
Mostly between November and March, the southern summer. January and February 2026 were the highest in the series for those months.
Do Canadians need a visa to visit Chile?
Not as tourists. Always confirm current requirements with the Chilean consulate or the National Migration Service before travelling.
How to cite this data
Viajando Chile (2026). *Canadian tourists in Chile 2026: a record 44,437 in 2025 and up 9.4% to August*. Based on data from the Undersecretariat of Tourism and Sernatur. Available at: https://viajandochile.com/en/news/canadian-tourists-in-chile-statistics