*Updated on 20 November 2026.*
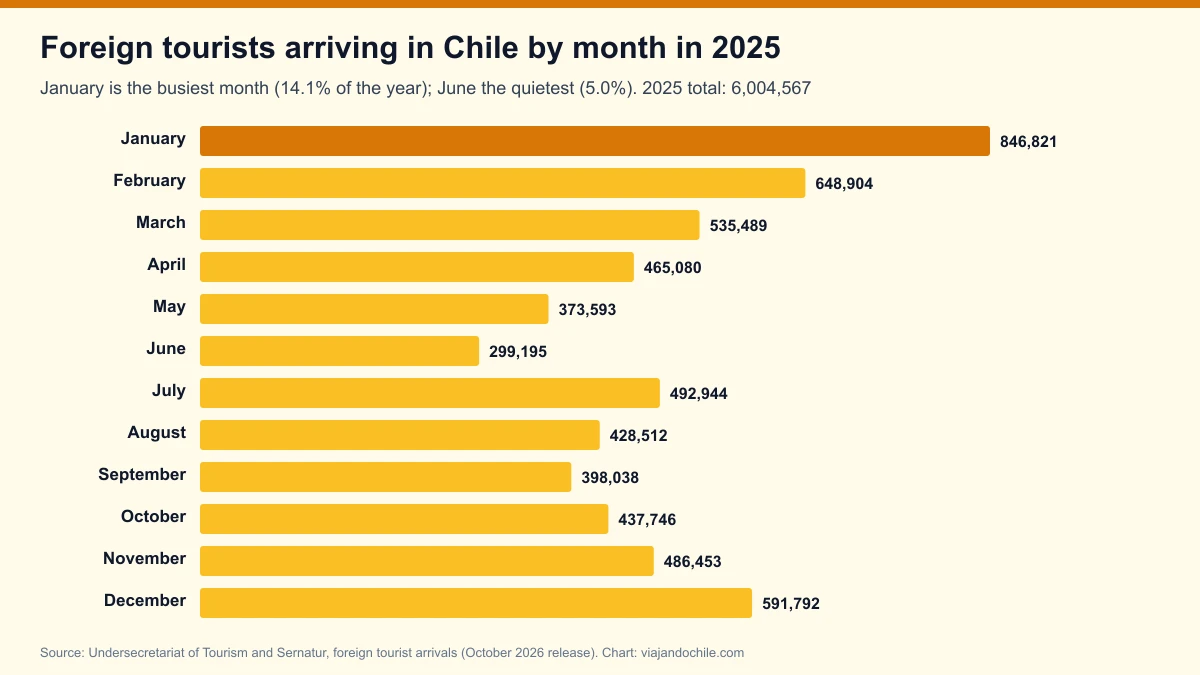
January is the month when most foreign tourists arrive in Chile: 846,821 entered in January 2025, 14.1% of the year's 6,004,567 tourists, according to the official series of the [Undersecretariat of Tourism and Sernatur](https://www.subturismo.gob.cl/wp-content/uploads/2026/10/202608-llegadas-de-turistas-extranjeros.xlsx). June is the quietest month, with 299,195 arrivals (5.0%). The series' monthly record is still January 2017, with 964,027 tourists.
For this analysis we added up, month by month, the arrivals in the detailed sheet of the official file (by border crossing and nationality) from 2013 to August 2026, the latest month published. The figures count foreign tourists entering the country, not overnight stays or spending.
View the data as a table
| Tourists in January 2025 | 846,821 |
| Tourists in June 2025 | 299,195 |
| Monthly record (January 2017) | 964,027 |
| January, February and December | 34.8% |
Foreign tourists in Chile by month in 2025
The curve has two peaks: the southern summer (December to February), which in 2025 accounted for 34.8% of the year's arrivals adding January, February and December, and a smaller second peak in July, driven by winter holidays and snow. The trough is in May and June, when half as many tourists arrive as in January.
| Month | Tourists in 2025 | % of the year | Record for the month (year) |
|---|---|---|---|
| January | 846,821 | 14.1% | 964,027 (2017) |
| February | 648,904 | 10.8% | 709,043 (2017) |
| March | 535,489 | 8.9% | 574,260 (2018) |
| April | 465,080 | 7.7% | 469,626 (2017) |
| May | 373,593 | 6.2% | 373,593 (2025) |
| June | 299,195 | 5.0% | 322,568 (2017) |
| July | 492,944 | 8.2% | 492,944 (2025) |
| August | 428,512 | 7.1% | 480,158 (2017) |
| September | 398,038 | 6.6% | 442,503 (2017) |
| October | 437,746 | 7.3% | 481,782 (2017) |
| November | 486,453 | 8.1% | 517,243 (2017) |
| December | 591,792 | 9.9% | 692,690 (2017) |
Source: Undersecretariat of Tourism and Sernatur, foreign tourist arrivals, series 2013 to August 2026 (October 2026 release); Viajando Chile calculation. May and July 2025 are the best ever for those months.

How Chile's tourist high season has changed since 2013
January was the busiest month every year in the series except 2024, when December overtook it (647,743 against 506,231), in a year when arrivals recovered month by month from a weak January. June was the quietest month in almost every year, except 2019, when the low point came in September. 2020 and 2021 are left out because borders were closed during the pandemic.
View the data as a table
| 2017 | 2019 | 2024 | 2025 | 2026 | |
|---|---|---|---|---|---|
| Jan | 964,027 | 625,376 | 506,231 | 846,821 | 710,346 |
| Feb | 709,043 | 436,778 | 419,183 | 648,904 | 508,281 |
| Mar | 521,123 | 454,800 | 451,176 | 535,489 | 446,702 |
| Apr | 469,626 | 377,684 | 395,615 | 465,080 | 344,615 |
| May | 357,953 | 306,465 | 335,372 | 373,593 | 277,915 |
| Jun | 322,568 | 299,955 | 281,837 | 299,195 | 265,864 |
| Jul | 491,167 | 376,029 | 460,267 | 492,944 | 410,213 |
| Aug | 480,158 | 322,858 | 397,988 | 428,512 | 344,937 |
| Sep | 442,503 | 288,537 | 381,702 | 398,038 | No data |
| Oct | 481,782 | 306,142 | 456,569 | 437,746 | No data |
| Nov | 517,243 | 292,215 | 505,550 | 486,453 | No data |
| Dec | 692,690 | 431,123 | 647,743 | 591,792 | No data |
| Year | Total tourists | Busiest month | Quietest month | January's share |
|---|---|---|---|---|
| 2016 | 5,640,700 | January (730,786) | June (301,805) | 13.0% |
| 2017 | 6,449,883 | January (964,027) | June (322,568) | 14.9% |
| 2018 | 5,722,928 | January (893,326) | June (281,417) | 15.6% |
| 2019 | 4,517,962 | January (625,376) | September (288,537) | 13.8% |
| 2023 | 3,730,507 | January (477,512) | June (202,720) | 12.8% |
| 2024 | 5,239,233 | December (647,743) | June (281,837) | 9.7% |
| 2025 | 6,004,567 | January (846,821) | June (299,195) | 14.1% |
Source: Undersecretariat of Tourism and Sernatur; Viajando Chile calculation using the monthly sum of the detailed sheet.
The busiest month for each country
Each market has its own season. Argentines come mostly in January, Brazilians in July for the snow, and Americans and Europeans in December and January, in the middle of the southern summer. Knowing each country's peak month explains why Santiago fills up in winter and Patagonia in summer.
| Nationality | Tourists in 2025 | Busiest month | Tourists that month | % of its year |
|---|---|---|---|---|
| Argentina | 2,856,441 | January | 517,976 | 18.1% |
| Brazil | 681,649 | July | 141,993 | 20.8% |
| Bolivia | 562,729 | December | 63,322 | 11.3% |
| Peru | 352,353 | January | 35,007 | 9.9% |
| United States | 250,460 | December | 43,699 | 17.4% |
| Colombia | 149,592 | December | 21,268 | 14.2% |
| Spain | 80,821 | December | 10,978 | 13.6% |
| Germany | 68,405 | January | 10,279 | 15.0% |
| France | 65,691 | December | 8,466 | 12.9% |
| Uruguay | 64,981 | April | 7,289 | 11.2% |
| Mexico | 61,139 | November | 7,400 | 12.1% |
Source: Undersecretariat of Tourism and Sernatur, 2025 arrivals by nationality; Viajando Chile calculation. We have country fact sheets for Argentina, Brazil and the United States.
High season by region of entry
The region through which tourists enter also sets their calendar. Through the Metropolitan Region (Santiago airport) the busiest month of 2025 was July, with 274,019 arrivals, while through Valparaíso (Los Libertadores pass) it was January, with 208,263. In the Coquimbo Region, the Agua Negra pass only operates in summer, which is why it records zero arrivals from June to August.
View the data as a table
| Coquimbo | 47.3% · 56,571 tourists in 2025 |
| Atacama | 32.1% · 9,277 tourists in 2025 |
| Maule | 27.0% · 72,960 tourists in 2025 |
| Biobío | 25.0% · 7,524 tourists in 2025 |
| Los Ríos | 22.1% · 18,470 tourists in 2025 |
| Aysén | 20.2% · 127,629 tourists in 2025 |
| Valparaíso | 18.6% · 1,120,230 tourists in 2025 |
| La Araucanía | 18.5% · 432,035 tourists in 2025 |
| Antofagasta | 17.4% · 201,910 tourists in 2025 |
| Magallanes | 17.2% · 405,627 tourists in 2025 |
| Los Lagos | 16.8% · 485,254 tourists in 2025 |
| Tarapacá | 11.0% · 382,734 tourists in 2025 |
| Arica y Parinacota | 10.7% · 315,671 tourists in 2025 |
| Metropolitana | 9.1% · 2,368,675 tourists in 2025 |
| Region of entry | Tourists in 2025 | Busiest month | Tourists that month |
|---|---|---|---|
| Metropolitana | 2,368,675 | July | 274,019 |
| Valparaíso | 1,120,230 | January | 208,263 |
| Los Lagos | 485,254 | January | 81,621 |
| La Araucanía | 432,035 | January | 79,960 |
| Magallanes | 405,627 | January | 69,638 |
| Tarapacá | 382,734 | January | 41,970 |
| Arica y Parinacota | 315,671 | January | 33,898 |
| Antofagasta | 201,910 | January | 35,081 |
| Aysén | 127,629 | January | 25,729 |
| Maule | 72,960 | January | 19,726 |
| Coquimbo | 56,571 | January | 26,759 |
Source: Undersecretariat of Tourism and Sernatur, 2025 arrivals by region of the entry crossing. To see how many tourists use each crossing, see Chile's highest border crossings, and for where they sleep, the most visited regions by overnight stays.
Tourist arrivals by month in 2026: down 19.1%
Between January and August 2026, 3,308,873 foreign tourists arrived, 19.1% fewer than in the same period of 2025, in line with the October Tourism Barometer. Every month fell: the sharpest drop was April (-25.9%) and the mildest June (-11.1%). The decline is explained by the Argentine market: tourists from Argentina went from 2,077,437 to 1,226,678 in those eight months (-41.0%), while all other nationalities combined grew 3.4% (from 2,013,101 to 2,082,195). In addition, long-haul markets point to a better summer, as shown by the air bookings report.
What it means if you are travelling to Chile
- January and February are the most expensive and crowded months on the coast, in the south and in Patagonia: book ahead.
- March, April, October and November combine good weather in much of the country with fewer tourists. We cover it in when to travel to Chile.
- July brings Brazilians to Santiago and the ski resorts: if you are going to the snow, buy passes and lodging early.
- May and June are the quietest months, with lower prices outside the winter resorts.
Frequently asked questions
Which month has the most tourists in Chile?
January. In 2025, 846,821 foreign tourists arrived, 14.1% of the year.
Which month has the fewest tourists?
June, with 299,195 arrivals in 2025 (5.0% of the year).
What is Chile's monthly record for foreign tourists?
January 2017, with 964,027 tourists, in the series starting in 2013.
Why is there a second peak in July?
Winter holidays and snow: Brazilians have their busiest month in July (141,993 in 2025) and Santiago receives more tourists than in January.
How to cite this data
Viajando Chile (2026). "Which month do most tourists visit Chile? Foreign tourist arrivals by month, 2013-2026". viajandochile.com, updated on 20 November 2026. https://viajandochile.com/en/news/foreign-tourists-in-chile-by-month-high-season-statistics. Data: Undersecretariat of Tourism and Sernatur, foreign tourist arrivals (series to August 2026).