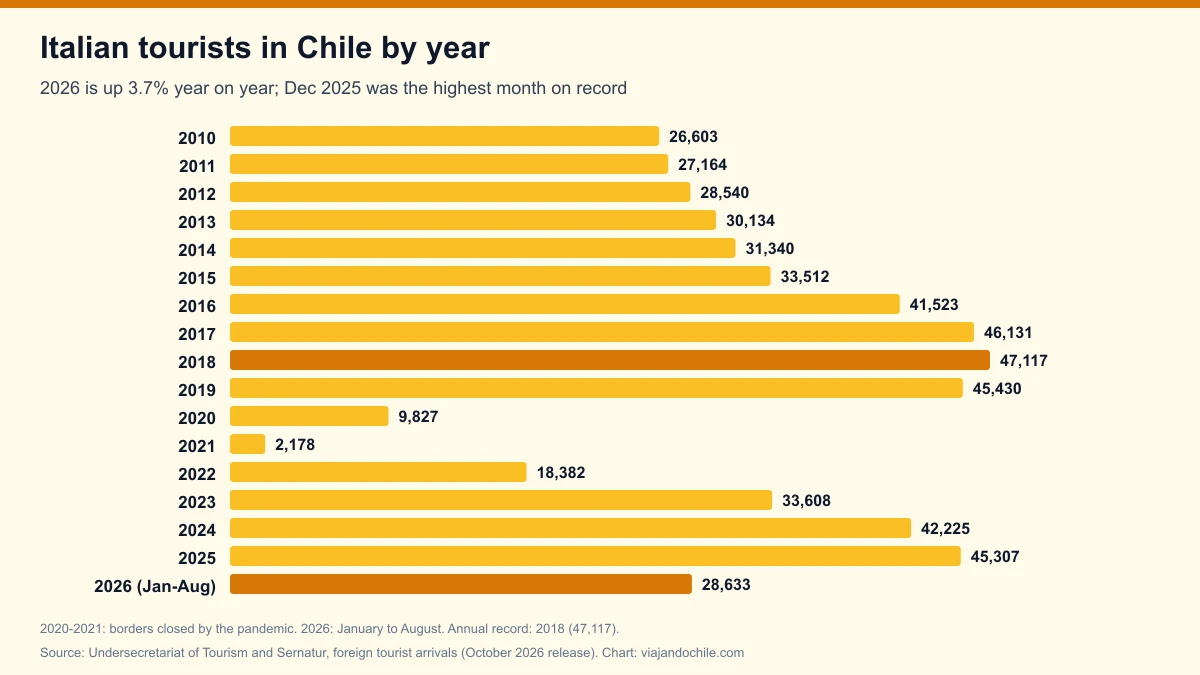
Between January and August 2026, 28,633 Italian tourists arrived in Chile, 3.7% more than in the same period of 2025 (27,607) and 2.3% fewer than in the same months of 2019 (29,322). That is what the foreign tourist arrival data from Chile's Undersecretariat of Tourism and Sernatur show, based on Investigations Police records. December 2025, with 6,853 arrivals, and January 2026, with 6,421, are the two months with the most Italians in the whole series, which starts in 2008.
*Updated on 8 November 2026, with the October 2026 release (data to August 2026).* Figures are foreign tourists by nationality, exclude arrivals by sea ports and are preliminary since 2020.
View the data as a table
| Arrivals Jan-Aug 2026 | 28,633 |
| Arrivals in 2025 | 45,307 |
| Annual record | 47,117 |
Italian tourists in Chile by year
The series starts in 2008 with 28,778 Italians. The figure grew almost every year to the 2018 record (47,117), fell to 2,178 in 2021 with borders closed and recovered quickly: 2025 ended with 45,307, 3.8% below the record. In 2025 Italy ranked 14th among countries sending tourists to Chile and fifth in Europe.
View the data as a table
| Italian tourists | |
|---|---|
| 2008 | 28,778 |
| 2009 | 27,477 |
| 2010 | 26,603 |
| 2011 | 27,164 |
| 2012 | 28,540 |
| 2013 | 30,134 |
| 2014 | 31,340 |
| 2015 | 33,512 |
| 2016 | 41,523 |
| 2017 | 46,131 |
| 2018 | 47,117 |
| 2019 | 45,430 |
| 2020 | 9,827 |
| 2021 | 2,178 |
| 2022 | 18,382 |
| 2023 | 33,608 |
| 2024 | 42,225 |
| 2025 | 45,307 |
| Year | Italian tourists | Year | Italian tourists |
|---|---|---|---|
| 2008 | 28,778 | 2017 | 46,131 |
| 2009 | 27,477 | 2018 | 47,117 (record) |
| 2010 | 26,603 | 2019 | 45,430 |
| 2011 | 27,164 | 2020 | 9,827 |
| 2012 | 28,540 | 2021 | 2,178 |
| 2013 | 30,134 | 2022 | 18,382 |
| 2014 | 31,340 | 2023 | 33,608 |
| 2015 | 33,512 | 2024 | 42,225 |
| 2016 | 41,523 | 2025 | 45,307 |
Source: Undersecretariat of Tourism and Sernatur, "Cuadro por Nacionalidad" sheet. 2026 stands at 28,633 to August.
Italian tourists in Chile in 2026, month by month
Italians travel in the southern summer, which coincides with their Christmas and New Year holidays. December 2025 (6,853) beat the previous monthly record, January 2018 (6,298), and January 2026 (6,421) came second. March 2026 (4,244) was also the highest March in the series. August is the other strong month, with the European summer holidays.
View the data as a table
| 2019 | 2025 | 2026 | |
|---|---|---|---|
| Jan | 6,004 | 5,929 | 6,421 |
| Feb | 4,030 | 3,978 | 4,131 |
| Mar | 3,826 | 3,610 | 4,244 |
| Apr | 3,312 | 2,934 | 2,867 |
| May | 2,223 | 2,225 | 2,060 |
| Jun | 2,122 | 1,735 | 1,838 |
| Jul | 2,448 | 2,498 | 2,415 |
| Aug | 5,357 | 4,698 | 4,657 |
| Sep | 2,897 | 2,664 | No data |
| Oct | 3,489 | 3,236 | No data |
| Nov | 4,090 | 4,947 | No data |
| Dec | 5,632 | 6,853 | No data |
| Month | 2019 | 2025 | 2026 |
|---|---|---|---|
| January | 6,004 | 5,929 | 6,421 (record for the month) |
| February | 4,030 | 3,978 | 4,131 |
| March | 3,826 | 3,610 | 4,244 (record for the month) |
| April | 3,312 | 2,934 | 2,867 |
| May | 2,223 | 2,225 | 2,060 |
| June | 2,122 | 1,735 | 1,838 |
| July | 2,448 | 2,498 | 2,415 |
| August | 5,357 | 4,698 | 4,657 |
| September | 2,897 | 2,664 | — |
| October | 3,489 | 3,236 | — |
| November | 4,090 | 4,947 | — |
| December | 5,632 | 6,853 (all-time record) | — |
Source: Undersecretariat of Tourism and Sernatur. To see which months bring the most tourists overall, read the months with the most foreign tourists in Chile.

Italian tourists compared with the rest of Europe
Italy is Chile's fifth-largest European market, after Spain, Germany, France and the United Kingdom. It is growing at the same pace as Spain in 2026 (+3.7%). The full comparison is in European tourists in Chile by country.
| Country | 2025 | Jan-Aug 2026 | Change 2026 |
|---|---|---|---|
| Spain | 80,821 | 47,948 | +3.7% |
| Germany | 68,405 | 41,491 | +4.4% |
| France | 65,691 | 41,779 | +6.3% |
| United Kingdom ("England") | 56,748 | 37,847 | +8.8% |
| Italy | 45,307 | 28,633 | +3.7% |
Source: Undersecretariat of Tourism and Sernatur. See also our pages on Spanish, German, French and British tourists.
Where Italian tourists enter Chile
70% of Italians arrived in 2025 through Santiago airport (31,864), but 28% came overland from Argentina (12,523), a high share for a European market: many combine both countries' Patagonia. Río Don Guillermo, the Puerto Natales crossing, saw 2,887, and Hito Cajón, near San Pedro de Atacama, 2,320.
| Entry point | 2025 | Jan-Aug 2026 |
|---|---|---|
| Santiago airport | 31,864 | 20,257 |
| Río Don Guillermo | 2,887 | 1,681 |
| Hito Cajón | 2,320 | 1,162 |
| San Sebastián | 1,462 | 880 |
| Cristo Redentor (Los Libertadores) | 1,413 | 676 |
| Laurita Casas Viejas | 1,003 | 878 |
| Cardenal Samoré | 673 | 423 |
| Dorotea | 606 | 290 |
| Integración Austral (Monte Aymond) | 591 | 293 |
| Jama | 429 | 290 |
Source: Undersecretariat of Tourism and Sernatur, "CONSULTA_DESAGREGADA" sheet. The overall ranking is in border crossings with the most tourists.
By region of entry, after the Santiago Metropolitan Region come Magallanes (6,612 in 2025, 15%) and Antofagasta (3,145): the footprint of Patagonia and Torres del Paine and the Atacama Desert.
View the data as a table
| Metropolitana | 31,865 |
| Magallanes | 6,612 |
| Antofagasta | 3,145 |
| Valparaíso | 1,419 |
| Los Lagos | 967 |
| Arica y Parinacota | 393 |
| Aysén | 347 |
| La Araucanía | 303 |
| Tarapacá | 84 |
| Maule | 58 |
| Coquimbo | 47 |
| Los Ríos | 39 |
| Atacama | 27 |
| Biobío | 1 |

Frequently asked questions
How many Italian tourists visit Chile each year?
45,307 in 2025. The record is 2018, with 47,117. Between January and August 2026, 28,633 arrived, 3.7% more than in the same period of 2025.
In which month do most Italians travel to Chile?
December and January. December 2025 (6,853) is the month with the most Italians since the series began in 2008.
Where does Italy rank among countries visiting Chile?
14th in 2025 and fifth in Europe. Between January and August 2026 it ranks 16th.
How to cite this data
Viajando Chile (2026). *Italian tourists in Chile 2026: 28,633 arrivals to August, up 3.7%, and the two highest months on record*. Based on data from the Undersecretariat of Tourism and Sernatur. Available at: https://viajandochile.com/en/news/italian-tourists-in-chile-statistics