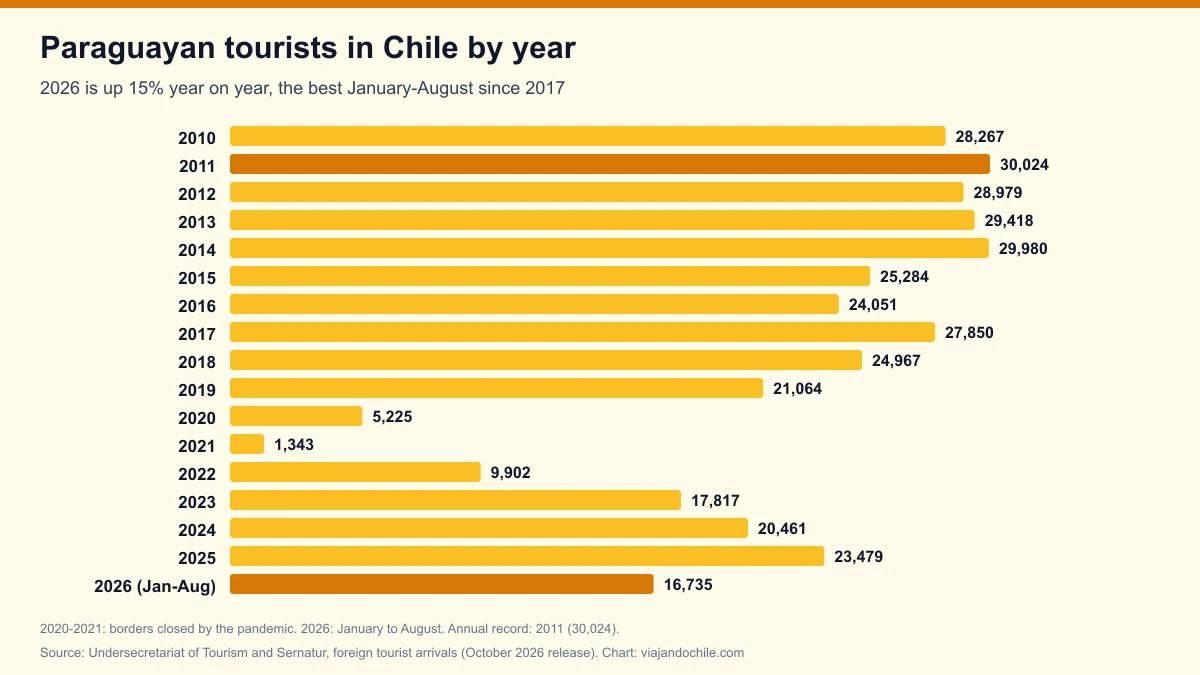
Between January and August 2026, 16,735 Paraguayan tourists arrived in Chile, 15.0% more than in the same period of 2025 (14,558) and 12.5% above the same months of 2019 (14,880). It is the best January-August since 2017 (19,288). That is what the foreign tourist arrivals data from the Undersecretariat of Tourism and Sernatur show. Unlike almost every other market, most Paraguayans arrive overland.
*Updated on 9 November 2026, with the October 2026 release (data through August 2026).* The figures refer to foreign tourists by nationality, exclude entries through seaports and are preliminary since 2020.
View the data as a table
| Arrivals Jan-Aug 2026 | 16,735 |
| Arrivals in 2025 | 23,479 |
| Annual record | 30,024 |
Paraguayan tourists in Chile by year
The best period for Paraguayans in Chile was between 2010 and 2014, with about 30,000 arrivals a year; the record is 2011, with 30,024. The figure then fell to around 25,000 and dropped to 1,343 in 2021. The recovery was slow but steady: 17,817 in 2023, 20,461 in 2024 and 23,479 in 2025, when Paraguay was the 18th country for arrivals.
View the data as a table
| Paraguayan tourists | |
|---|---|
| 2008 | 22,853 |
| 2009 | 22,349 |
| 2010 | 28,267 |
| 2011 | 30,024 |
| 2012 | 28,979 |
| 2013 | 29,418 |
| 2014 | 29,980 |
| 2015 | 25,284 |
| 2016 | 24,051 |
| 2017 | 27,850 |
| 2018 | 24,967 |
| 2019 | 21,064 |
| 2020 | 5,225 |
| 2021 | 1,343 |
| 2022 | 9,902 |
| 2023 | 17,817 |
| 2024 | 20,461 |
| 2025 | 23,479 |
| Year | Paraguayan tourists | Year | Paraguayan tourists |
|---|---|---|---|
| 2008 | 22,853 | 2017 | 27,850 |
| 2009 | 22,349 | 2018 | 24,967 |
| 2010 | 28,267 | 2019 | 21,064 |
| 2011 | 30,024 (record) | 2020 | 5,225 |
| 2012 | 28,979 | 2021 | 1,343 |
| 2013 | 29,418 | 2022 | 9,902 |
| 2014 | 29,980 | 2023 | 17,817 |
| 2015 | 25,284 | 2024 | 20,461 |
| 2016 | 24,051 | 2025 | 23,479 |
Source: Undersecretariat of Tourism and Sernatur, "Cuadro por Nacionalidad" sheet. 2026 stands at 16,735 through August.
Paraguayan tourists in Chile month by month: summer rules
January is Paraguayans' strong month, with the summer holidays: in January 2026, 3,255 arrived, the highest figure for that month since 2018 (3,590). In 2026 March also stood out (2,885, 45% more than in March 2025). June and July, in winter, are the lowest months. The series' monthly record is still January 2014, with 4,245.
View the data as a table
| 2019 | 2025 | 2026 | |
|---|---|---|---|
| Jan | 2,967 | 3,113 | 3,255 |
| Feb | 1,795 | 2,187 | 2,164 |
| Mar | 2,111 | 1,983 | 2,885 |
| Apr | 2,120 | 1,584 | 2,006 |
| May | 1,618 | 1,642 | 1,674 |
| Jun | 1,279 | 964 | 1,522 |
| Jul | 1,465 | 1,558 | 1,646 |
| Aug | 1,525 | 1,527 | 1,583 |
| Sep | 1,527 | 1,966 | No data |
| Oct | 1,642 | 2,343 | No data |
| Nov | 1,459 | 2,491 | No data |
| Dec | 1,556 | 2,121 | No data |
| Month | 2019 | 2025 | 2026 |
|---|---|---|---|
| January | 2,967 | 3,113 | 3,255 |
| February | 1,795 | 2,187 | 2,164 |
| March | 2,111 | 1,983 | 2,885 |
| April | 2,120 | 1,584 | 2,006 |
| May | 1,618 | 1,642 | 1,674 |
| June | 1,279 | 964 | 1,522 |
| July | 1,465 | 1,558 | 1,646 |
| August | 1,525 | 1,527 | 1,583 |
| September | 1,527 | 1,966 | — |
| October | 1,642 | 2,343 | — |
| November | 1,459 | 2,491 | — |
| December | 1,556 | 2,121 | — |
Source: Undersecretariat of Tourism and Sernatur.
Where Paraguayan tourists enter Chile: Jama, the great overland gateway
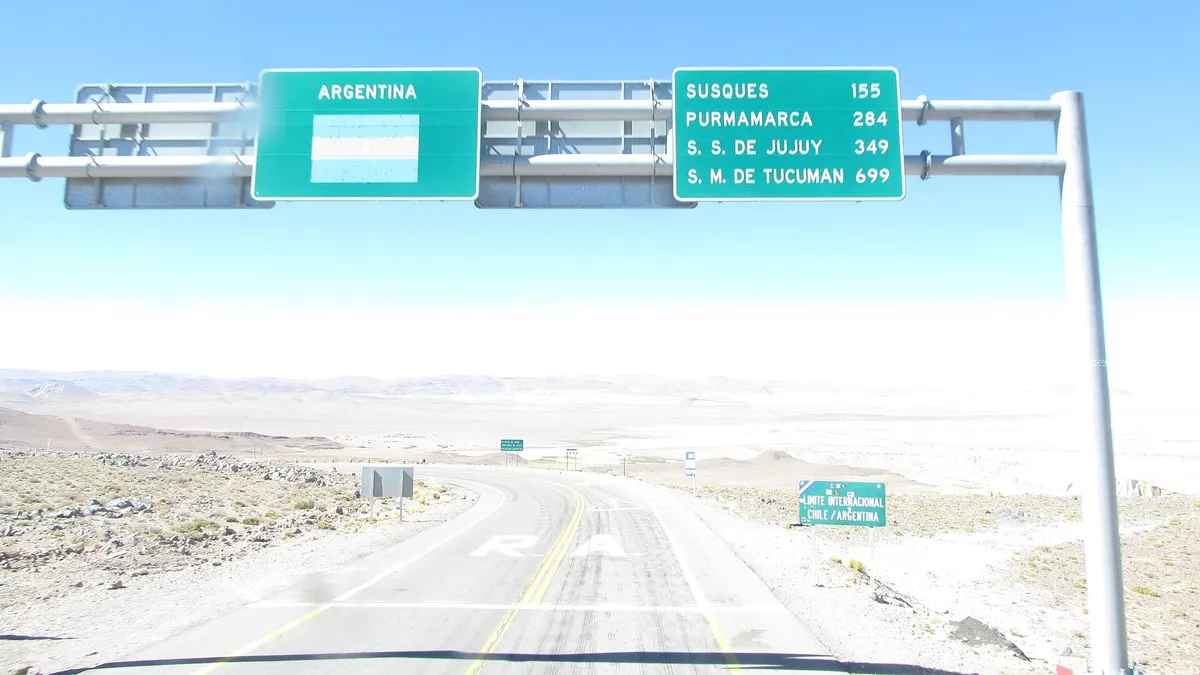
In 2025, 54.7% of Paraguayans entered through land crossings and 45.3% through airports, an unusual split among markets that are not neighbors. The Jama pass, in the Antofagasta Region, received 4,928 Paraguayans (21% of the total), who arrive by car or bus through northern Argentina towards San Pedro de Atacama and the coast. Next come Cristo Redentor (2,992) and the Patagonian crossings, such as Integración Austral (1,046), Cardenal Samoré (893) and San Sebastián (771).
| Entry point | 2025 | Jan-Aug 2026 |
|---|---|---|
| Santiago airport | 10,602 | 7,624 |
| Jama | 4,928 | 4,054 |
| Cristo Redentor (Los Libertadores) | 2,992 | 2,227 |
| Integración Austral (Monte Aymond) | 1,046 | 518 |
| Cardenal Samoré | 893 | 460 |
| San Sebastián | 771 | 365 |
| Chacalluta (Concordia) | 388 | 319 |
| Pino Hachado | 320 | 246 |
| Río Jeinimeni | 281 | 170 |
| Puesco (Mamuil Malal) | 227 | 97 |
Source: Undersecretariat of Tourism and Sernatur, "CONSULTA_DESAGREGADA" sheet. Between January and August 2026, Jama already totals 4,054 Paraguayans, 82% of all of 2025. If you travel overland, check the status of the crossings in our piece on border crossings with the most tourists and the route from Santiago to San Pedro de Atacama.
View the data as a table
| Metropolitana | 10,603 |
| Antofagasta | 5,034 |
| Valparaíso | 2,992 |
| Magallanes | 2,110 |
| Los Lagos | 983 |
| La Araucanía | 597 |
| Arica y Parinacota | 407 |
| Aysén | 395 |
| Tarapacá | 215 |
| Maule | 48 |
| Los Ríos | 34 |
| Atacama | 32 |
| Coquimbo | 22 |
| Biobío | 7 |
Paraguayan tourists compared with other countries
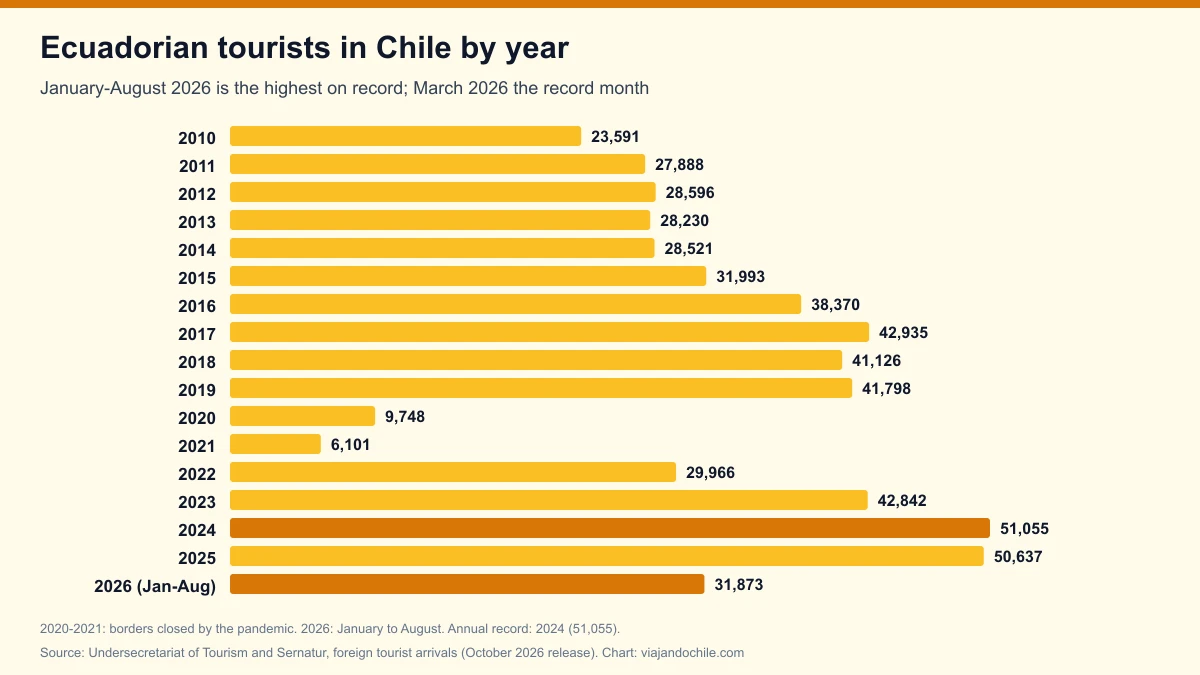
With 16,735 arrivals between January and August 2026, Paraguay is the 19th country of origin, behind Costa Rica and ahead of the Netherlands and Israel. Ecuador, the other market in this series, is 14th; we analyze it in Ecuadorian tourists in Chile. The neighbors that visit Chile the most are Argentina and Brazil: see Argentine tourists and Brazilian tourists.
| Rank | Country | Jan-Aug 2026 | 2025 |
|---|---|---|---|
| 17 | Canada | 28,617 | 44,437 |
| 18 | Costa Rica | 18,592 | 17,132 |
| 19 | Paraguay | 16,735 | 23,479 |
| 20 | Netherlands ("Holanda") | 12,920 | 20,853 |
| 21 | Israel | 11,185 | 15,842 |
Source: Undersecretariat of Tourism and Sernatur; ranks among foreign nationalities.
If you cross in a rental car you need the company's permission to leave the country; we explain it in the guide to car rental in Chile for foreigners.
Frequently asked questions
How many Paraguayan tourists visit Chile each year?
23,479 in 2025. The record is from 2011, with 30,024. Between January and August 2026, 16,735 arrived, 15.0% more than in the same period of 2025.
How do Paraguayans get to Chile?
More than half overland (54.7% in 2025), mainly through the Jama pass, and the rest by air through Santiago.
When do Paraguayans travel to Chile the most?
In January, during their summer holidays. June and July are the lowest months.
How to cite this data
Viajando Chile (2026). *Paraguayan tourists in Chile 2026: 16,735 arrivals through August, up 15%, and more than half come overland*. Based on data from the Undersecretariat of Tourism and Sernatur. Available at: https://viajandochile.com/en/news/paraguayan-tourists-in-chile-statistics