Tourism generated CLP 386 billion in the Maule Region in 2025, 4.06% of Chile's tourism GDP, which places it ninth among the 16 regions. That is what the regional tourism GDP fact sheet from the Undersecretariat of Tourism shows; the regional Economy Secretariat and Sernatur's regional office presented it in the region this week, according to Diario Talca and Linares en Línea. Tourism accounts for 3.1% of Maule's economy, more than the national average (2.8%).
The measurement, experimental and at current prices, counts what accommodation, restaurants, passenger transport, retail, agencies and recreation generate when they serve tourists and day-trippers. It is the same one that in October showed Magallanes as the region where tourism weighs the most, as we reported in our piece on regional tourism GDP. The Undersecretariat has now published the full tables for all 16 regions.
View the data as a table
| Tourism GDP | $386 bn |
| Share of national tourism | 4.06% |
| Weight in the regional economy | 3.1% |
| Jobs in tourism activities | 28,500 |
Maule's tourism GDP year by year
Between 2018 and 2025 Maule's tourism GDP rose from CLP 236 billion to CLP 386 billion, an increase of 64% in current pesos, slightly above the national 61%. But the regional economy grew faster (72%), so tourism's share fell from 3.3% to 3.1%. The worst year was 2020, with the pandemic.
| Year | Tourism GDP (CLP billion) | Share of regional GDP | Rank by share | Share of national tourism | Rank by national share |
|---|---|---|---|---|---|
| 2018 | 236 | 3.3% | 11th | 3.99% | 9th |
| 2019 | 244 | 3.3% | 11th | 4.05% | 9th |
| 2020 | 195 | 2.4% | 10th | 5.21% | 8th |
| 2021 | 237 | 2.7% | 9th | 5.23% | 9th |
| 2022 | 305 | 3.3% | 10th | 5.11% | 7th |
| 2023 | 341 | 3.2% | 10th | 4.28% | 9th |
| 2024 (p) | 361 | 3.0% | 10th | 4.04% | 9th |
| 2025 (p) | 386 | 3.1% | 10th | 4.06% | 9th |
Source: Undersecretariat of Tourism, Maule regional fact sheet (6 October 2026). (p) = preliminary. In 2020 and 2021 Maule's share rose because almost all tourism was domestic.
View the data as a table
| Maule | Chile | |
|---|---|---|
| 2018 | 3.3% | 3.1% |
| 2019 | 3.3% | 3.1% |
| 2020 | 2.4% | 1.9% |
| 2021 | 2.7% | 1.9% |
| 2022 | 3.3% | 2.3% |
| 2023 | 3.2% | 2.8% |
| 2024 | 3.0% | 2.9% |
| 2025 | 3.1% | 2.8% |
The other figure released in the region is employment: about 28,500 people worked on average in 2025 in accommodation, restaurants and passenger transport, 5.5% of Maule's employment. The figure includes those who also serve residents, according to Diario Talca.
Where Maule stands against the other regions
The Undersecretariat reads regional tourism in two ways. The share shows what part of the country's tourism takes place in each region: the Metropolitan Region concentrates 38.5% and Aysén 0.94%. The intensity shows how much tourism weighs within the region's economy: Magallanes leads with 7.3%, and Antofagasta, with mining, comes last with 1.5%. Maule sits mid-table on both.
View the data as a table
| Magallanes | 7.3% |
| La Araucanía | 5.3% |
| Los Ríos | 4.9% |
| Los Lagos | 4.8% |
| Valparaíso | 4.7% |
| Aysén | 4.5% |
| Arica y Parinacota | 4.4% |
| Ñuble | 4.1% |
| Coquimbo | 4.0% |
| Maule | 3.1% |
| Tarapacá | 2.9% |
| Metropolitana | 2.9% |
| O'Higgins | 2.8% |
| Biobío | 2.8% |
| Atacama | 1.6% |
| Antofagasta | 1.5% |
View the data as a table
| Tourism as % of regional GDP | Share of Chile's tourism GDP | |
|---|---|---|
| Arica y Parinacota | 4% | 1% |
| Tarapacá | 3% | 3% |
| Antofagasta | 2% | 6% |
| Atacama | 2% | 2% |
| Coquimbo | 4% | 5% |
| Valparaíso | 5% | 12% |
| O'Higgins | 3% | 4% |
| Maule | 3% | 4% |
| Ñuble | 4% | 2% |
| Biobío | 3% | 6% |
| La Araucanía | 5% | 5% |
| Los Ríos | 5% | 2% |
| Los Lagos | 5% | 6% |
| Aysén | 5% | 1% |
| Magallanes | 7% | 2% |
| Region | Tourism GDP 2025 (CLP billion) | Share of country | Weight in the region | Growth 2018-2025 |
|---|---|---|---|---|
| Metropolitana | 3,664 | 38.54% | 2.9% | 52% |
| Valparaíso | 1,165 | 12.25% | 4.7% | 69% |
| Antofagasta | 580 | 6.10% | 1.5% | 82% |
| Biobío | 543 | 5.71% | 2.8% | 64% |
| Los Lagos | 531 | 5.59% | 4.8% | 66% |
| La Araucanía | 492 | 5.18% | 5.3% | 65% |
| Coquimbo | 460 | 4.84% | 4.0% | 73% |
| O'Higgins | 405 | 4.26% | 2.8% | 71% |
| Maule | 386 | 4.06% | 3.1% | 64% |
| Tarapacá | 278 | 2.93% | 2.9% | 62% |
| Magallanes | 226 | 2.38% | 7.3% | 56% |
| Los Ríos | 208 | 2.18% | 4.9% | 65% |
| Ñuble | 193 | 2.03% | 4.1% | 62% |
| Atacama | 166 | 1.75% | 1.6% | 70% |
| Arica y Parinacota | 119 | 1.25% | 4.4% | 22% |
| Aysén | 89 | 0.94% | 4.5% | 44% |
Source: Undersecretariat of Tourism, regional tourism GDP tables 2018-2025 (data as of 22 September 2026). Regional intensities use each region's GDP from the Central Bank; the national 2.8% uses national GDP. All the fact sheets are on the regional tourism GDP page.
| Arica y Parinacota | 119 | 1.25% | 4.4% | 22% |
| Tarapacá | 278 | 2.93% | 2.9% | 62% |
| Antofagasta | 580 | 6.10% | 1.5% | 82% |
| Atacama | 166 | 1.75% | 1.6% | 70% |
| Coquimbo | 460 | 4.84% | 4.0% | 73% |
| Valparaíso | 1,165 | 12.25% | 4.7% | 69% |
| Metropolitana | 3,664 | 38.54% | 2.9% | 52% |
| O'Higgins | 405 | 4.26% | 2.8% | 71% |
| Maule | 386 | 4.06% | 3.1% | 64% |
| Ñuble | 193 | 2.03% | 4.1% | 62% |
| Biobío | 543 | 5.71% | 2.8% | 64% |
| La Araucanía | 492 | 5.18% | 5.3% | 65% |
| Los Ríos | 208 | 2.18% | 4.9% | 65% |
| Los Lagos | 531 | 5.59% | 4.8% | 66% |
| Aysén | 89 | 0.94% | 4.5% | 44% |
| Magallanes | 226 | 2.38% | 7.3% | 56% |
The challenge for tourism in Maule: getting visitors to stay overnight
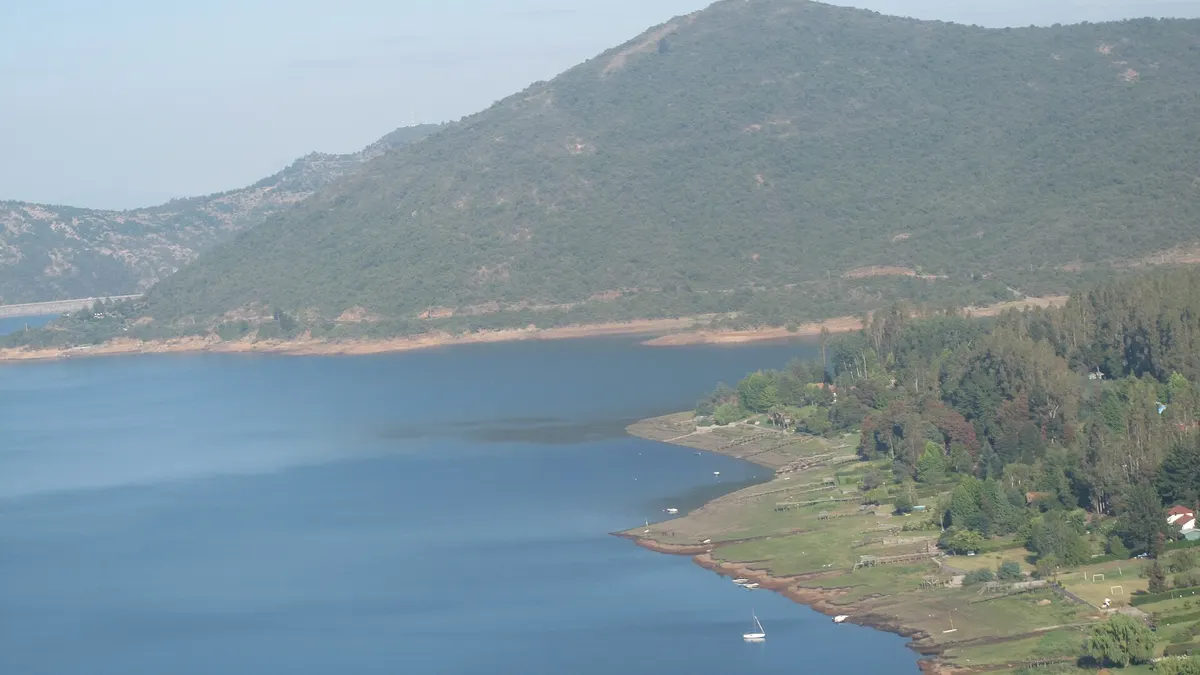
Maule is the sixth destination for domestic tourism trips, with 7.8% of the total, but it only accounts for 2.7% of nights in tourist accommodation in the country, according to data presented by the regional Economy Secretariat and reported by Linares en Línea. In other words, many people pass through the region or visit it for the day. The regional Economy secretary, Katherine Núñez, said the priority is for visitors to "stay more nights" and spend in the municipalities; Sernatur's regional director, Alejandra Casanova, mentioned a municipal tourism program in 17 municipalities funded by the Regional Government.
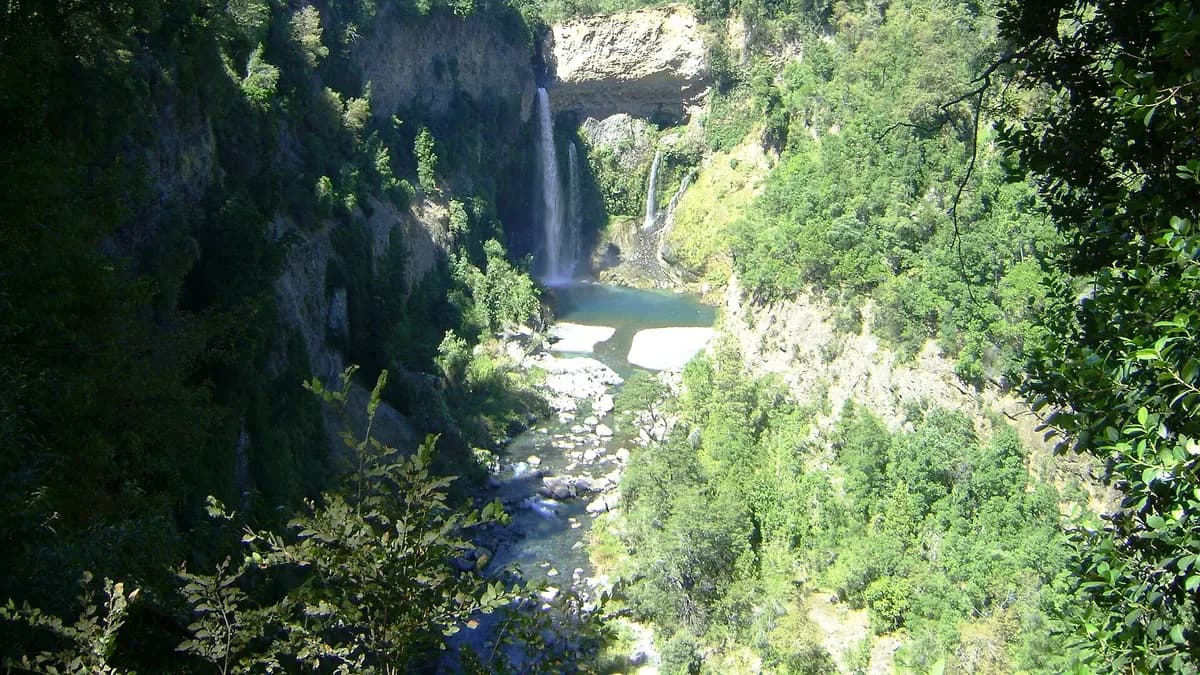
- Radal Siete Tazas: Maule's most visited national park, with about 123,000 visits in 2025; see the guide to Radal Siete Tazas and the most visited park in each region.
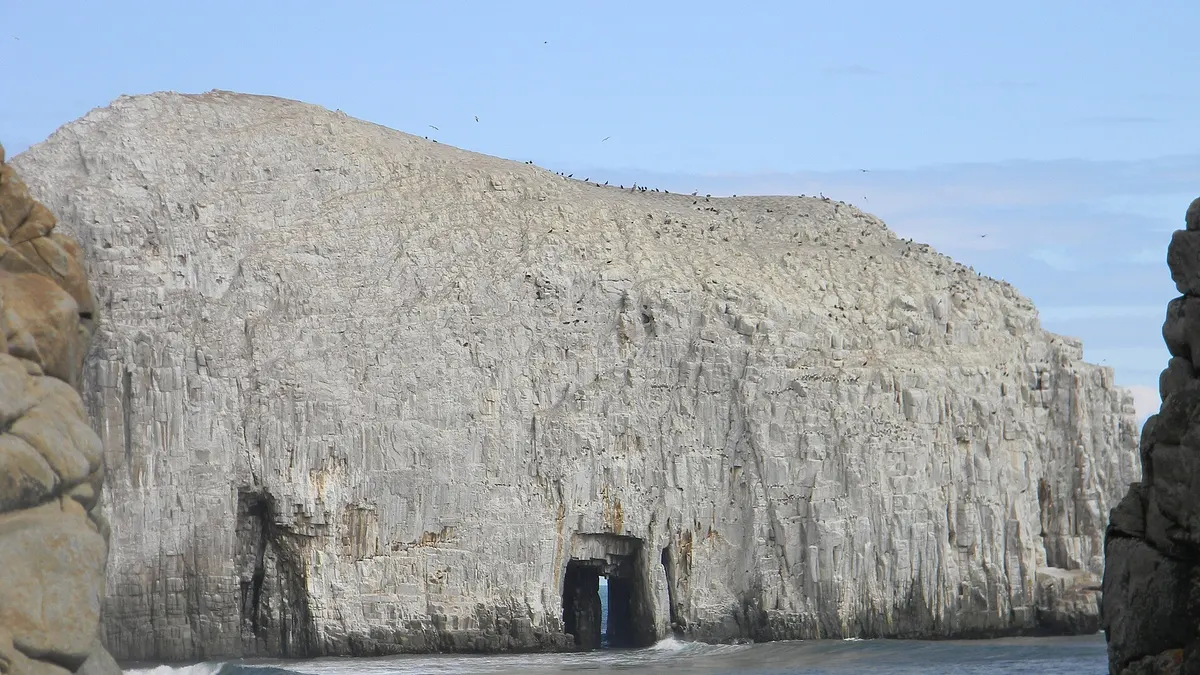
- The coast: Constitución, Pelluhue and Curanipe, with dark-sand beaches and formations such as the Piedra de la Iglesia.
- Lakes and wine: Colbún and Vichuquén, and the Curicó and Maule valleys; for dry-farmed wines, see the wines of the dry interior.
- Towards Argentina: with the Pehuenche pass open from this Monday, Maule is once again a route to Malargüe; the discounts of the Pase Andes Conecta apply on both sides.
Do you run a hotel, winery or tour in Maule and want to reach people planning their trip?
See advertising optionsFrequently asked questions
How much does tourism contribute to Maule?
CLP 386 billion in 2025, according to the Undersecretariat of Tourism: 3.1% of regional GDP and 4.06% of Chile's tourism GDP.
Which region has Chile's largest tourism GDP?
The Metropolitan Region, with CLP 3,664 billion (38.5% of the total). By weight within its economy, Magallanes comes first, with 7.3%.
Is it an official figure?
It is an experimental statistic from the Undersecretariat of Tourism's Research Division, with preliminary 2024 and 2025 data. It is not a regional satellite account or a national accounts figure.