*Updated on 17 November 2026.*
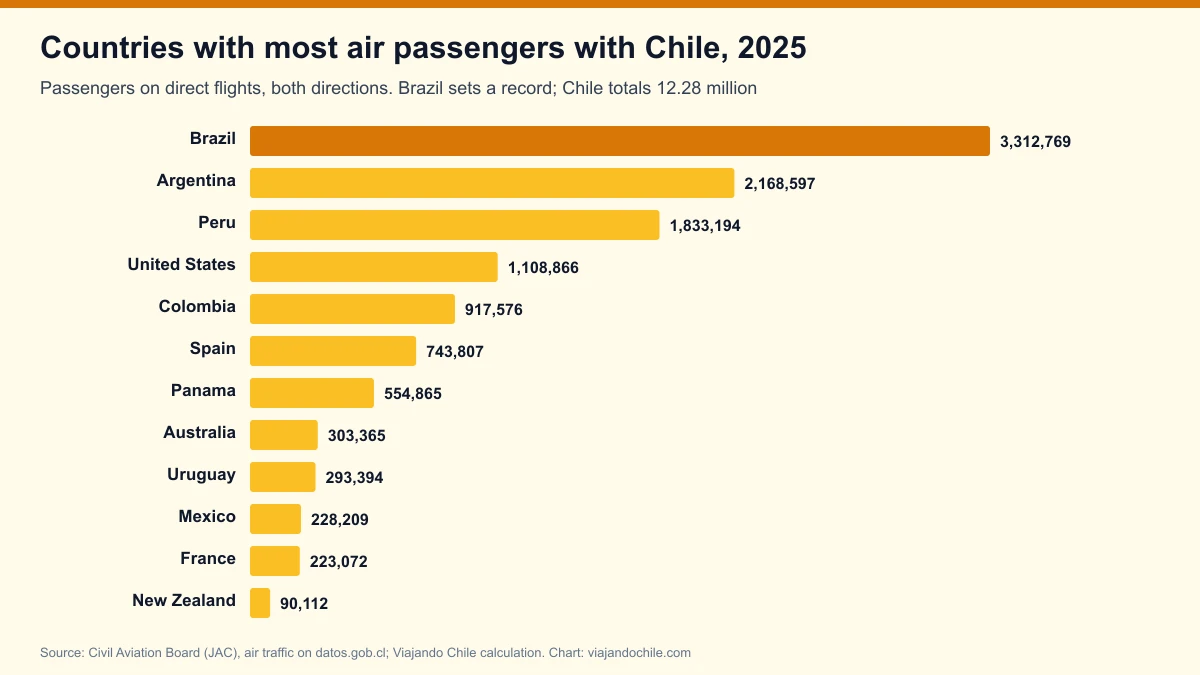
Brazil was the country with the most air passengers to and from Chile in 2025: 3,312,769 people flew between the two countries on direct flights, an all-time record and 27.0% of all Chilean international traffic, according to data from Chile's [Civil Aviation Board (JAC)](https://datos.gob.cl/dataset/trafico-aereo). Argentina came second with 2,168,597 passengers and Peru third with 1,833,194.
In total, Chile handled 12,278,197 international passengers in 2025, the highest figure in the series, up 3.9% on 2024 and 10.6% above 2019. Brazil overtook Argentina for first place in 2023, the first time in a normal year since 1984 (Peru led in 2020 and 2021, when borders were closed), and has stayed ahead since.
View the data as a table
| International passengers (record) | 12.28 M |
| Passengers to/from Brazil | 3.31 M |
| Countries with direct flights and over 40,000 passengers | 20 |
Ranking of countries with the most air passengers to Chile in 2025
| # | Country | Passengers 2025 | Change vs 2024 | Record year |
|---|---|---|---|---|
| 1 | Brazil | 3,312,769 | +6.0% | 2025 |
| 2 | Argentina | 2,168,597 | +5.6% | 2017 (2,697,985) |
| 3 | Peru | 1,833,194 | +1.9% | 2019 (1,922,141) |
| 4 | United States | 1,108,866 | -2.1% | 2017 (1,183,748) |
| 5 | Colombia | 917,576 | -4.3% | 2024 (959,146) |
| 6 | Spain | 743,807 | +3.0% | 2025 |
| 7 | Panama | 554,865 | +2.0% | 2025 |
| 8 | Australia | 303,365 | +28.1% | 2019 (354,411) |
| 9 | Uruguay | 293,394 | +5.1% | 2017 (303,976) |
| 10 | Mexico | 228,209 | +2.4% | 2017 (328,549) |
| 11 | France | 223,072 | +5.6% | 2019 (242,575) |
| 12 | New Zealand | 90,112 | -0.3% | 2017 (109,763) |
| 13 | Dominican Republic | 83,067 | +38.1% | 2025 |
| 14 | Ecuador | 80,379 | -1.5% | 2012 (137,136) |
| 15 | United Kingdom | 75,051 | -13.5% | 2019 (100,182) |
| 16 | Paraguay | 69,494 | +6.4% | |
| 17 | Canada | 56,322 | +6.1% | |
| 18 | Netherlands | 47,706 | -8.0% | |
| 19 | Türkiye | 45,519 | New in 2025 | 2025 |
| 20 | Bolivia | 42,757 | -1.9% |
Source: JAC, air traffic on datos.gob.cl, historical file 1984-2025. Viajando Chile calculation: sum of passengers on international flights in both directions, assigned to the flight's origin or destination country outside Chile. A connecting passenger (for example, Santiago-São Paulo-Lisbon) is counted in the country of the first flight, which is why countries without direct flights, such as Italy or Germany, do not appear.
Map of countries with the most air passengers to Chile
View the data as a table
| Brazil | 3,312,769 |
| Argentina | 2,168,597 |
| Peru | 1,833,194 |
| United States | 1,108,866 |
| Colombia | 917,576 |
| Spain | 743,807 |
| Panama | 554,865 |
| Australia | 303,365 |
| Uruguay | 293,394 |
| Mexico | 228,209 |
| France | 223,072 |
| New Zealand | 90,112 |
| Dominican Republic | 83,067 |
| Ecuador | 80,379 |
| United Kingdom | 75,051 |
| Paraguay | 69,494 |
| Canada | 56,322 |
| Netherlands | 47,706 |
| Türkiye | 45,519 |
| Bolivia | 42,757 |
South America dominates: Brazil, Argentina, Peru, Colombia, Uruguay, Ecuador, Paraguay and Bolivia add up to 8.7 million passengers, 71.0% of the total. Outside the region, the United States, Spain and Panama (the latter thanks to Copa's hub) stand out. Oceania appears through Australia and New Zealand, and Türkiye joined in 2025 with Turkish Airlines' route to Istanbul.
Brazil, Argentina and Peru: the trend since 2005
View the data as a table
| Brazil | Argentina | Peru | United States | |
|---|---|---|---|---|
| 2005 | 0.55 M | 1.25 M | 0.26 M | 0.55 M |
| 2006 | 0.62 M | 1.24 M | 0.27 M | 0.60 M |
| 2007 | 0.80 M | 1.47 M | 0.37 M | 0.65 M |
| 2008 | 0.81 M | 1.32 M | 0.42 M | 0.65 M |
| 2009 | 0.69 M | 1.21 M | 0.46 M | 0.62 M |
| 2010 | 0.77 M | 1.38 M | 0.50 M | 0.64 M |
| 2011 | 0.91 M | 1.56 M | 0.66 M | 0.72 M |
| 2012 | 1.16 M | 1.67 M | 0.84 M | 0.79 M |
| 2013 | 1.16 M | 1.68 M | 0.85 M | 0.83 M |
| 2014 | 1.34 M | 1.71 M | 0.94 M | 0.85 M |
| 2015 | 1.54 M | 1.86 M | 1.11 M | 1.06 M |
| 2016 | 1.56 M | 2.12 M | 1.29 M | 1.17 M |
| 2017 | 1.75 M | 2.70 M | 1.50 M | 1.18 M |
| 2018 | 2.09 M | 2.47 M | 1.71 M | 1.17 M |
| 2019 | 2.02 M | 2.18 M | 1.92 M | 1.17 M |
| 2020 | 0.53 M | 0.48 M | 0.54 M | 0.38 M |
| 2021 | 0.20 M | 0.20 M | 0.38 M | 0.44 M |
| 2022 | 0.94 M | 1.20 M | 1.16 M | 1.00 M |
| 2023 | 1.95 M | 1.88 M | 1.50 M | 1.11 M |
| 2024 | 3.13 M | 2.05 M | 1.80 M | 1.13 M |
| 2025 | 3.31 M | 2.17 M | 1.83 M | 1.11 M |
| Year | Brazil | Argentina | Peru | United States |
|---|---|---|---|---|
| 2005 | 550,100 | 1,250,401 | 260,128 | 553,584 |
| 2010 | 769,246 | 1,384,522 | 495,780 | 641,260 |
| 2015 | 1,536,183 | 1,857,294 | 1,108,412 | 1,061,708 |
| 2017 | 1,751,198 | 2,697,985 | 1,495,827 | 1,183,748 |
| 2019 | 2,018,264 | 2,177,345 | 1,922,141 | 1,173,882 |
| 2020 | 529,175 | 476,758 | 541,052 | 382,038 |
| 2022 | 944,164 | 1,203,053 | 1,163,467 | 995,735 |
| 2023 | 1,953,771 | 1,878,549 | 1,499,938 | 1,110,062 |
| 2024 | 3,125,809 | 2,053,574 | 1,798,251 | 1,132,617 |
| 2025 | 3,312,769 | 2,168,597 | 1,833,194 | 1,108,866 |
Source: JAC. Each country's record in bold. Brazil grew more than sixfold between 2005 and 2025 and is up 64.1% on 2019, driven by new low-cost routes and the boom in Brazilian tourists to Chile, analysed in our Brazilian tourist statistics. Argentina, by contrast, is still 19.6% below its 2017 record.
How Chile's air ranking changed over 20 years
View the data as a table
| 2005 | 2006 | 2007 | 2008 | 2009 | 2010 | 2011 | 2012 | 2013 | 2014 | 2015 | 2016 | 2017 | 2018 | 2019 | 2020 | 2021 | 2022 | 2023 | 2024 | 2025 | |
|---|---|---|---|---|---|---|---|---|---|---|---|---|---|---|---|---|---|---|---|---|---|
| Brazil | 550,100 | 616,561 | 801,431 | 807,270 | 691,991 | 769,246 | 913,223 | 1,161,403 | 1,162,572 | 1,336,608 | 1,536,183 | 1,558,886 | 1,751,198 | 2,085,016 | 2,018,264 | 529,175 | 200,563 | 944,164 | 1,953,771 | 3,125,809 | 3,312,769 |
| Argentina | 1,250,401 | 1,240,490 | 1,469,540 | 1,316,916 | 1,212,012 | 1,384,522 | 1,562,783 | 1,672,062 | 1,675,001 | 1,706,764 | 1,857,294 | 2,123,924 | 2,697,985 | 2,469,377 | 2,177,345 | 476,758 | 200,769 | 1,203,053 | 1,878,549 | 2,053,574 | 2,168,597 |
| Peru | 260,128 | 265,809 | 374,053 | 420,766 | 456,567 | 495,780 | 662,802 | 843,932 | 853,418 | 937,598 | 1,108,412 | 1,292,753 | 1,495,827 | 1,708,159 | 1,922,141 | 541,052 | 378,146 | 1,163,467 | 1,499,938 | 1,798,251 | 1,833,194 |
| United States | 553,584 | 598,928 | 645,384 | 654,296 | 617,946 | 641,260 | 715,203 | 785,445 | 827,833 | 853,304 | 1,061,708 | 1,170,416 | 1,183,748 | 1,172,450 | 1,173,882 | 382,038 | 443,463 | 995,735 | 1,110,062 | 1,132,617 | 1,108,866 |
| Colombia | 72,815 | 87,567 | 110,735 | 121,171 | 113,478 | 138,331 | 181,668 | 269,060 | 314,563 | 345,763 | 475,786 | 572,899 | 587,084 | 643,237 | 665,278 | 205,105 | 245,886 | 755,736 | 869,399 | 959,146 | 917,576 |
| Spain | 310,425 | 361,252 | 374,390 | 361,730 | 331,686 | 338,447 | 348,373 | 344,423 | 359,749 | 378,852 | 382,913 | 429,036 | 471,261 | 474,901 | 588,663 | 177,292 | 174,348 | 420,366 | 544,472 | 722,430 | 743,807 |
| Panama | 80,252 | 111,869 | 128,272 | 125,028 | 125,984 | 163,491 | 237,484 | 305,033 | 390,860 | 411,895 | 411,198 | 464,449 | 501,488 | 478,688 | 468,553 | 138,925 | 180,137 | 519,692 | 548,578 | 543,933 | 554,865 |
| Australia | 52,448 | 61,929 | 75,414 | 83,104 | 69,397 | 61,991 | 62,508 | 137,140 | 147,295 | 163,054 | 181,214 | 224,805 | 254,037 | 304,036 | 354,411 | 96,095 | 318 | 56,505 | 171,299 | 236,803 | 303,365 |
| Uruguay | 106,354 | 117,091 | 115,714 | 129,888 | 187,320 | 217,084 | 289,679 | 253,671 | 199,324 | 204,500 | 216,283 | 244,875 | 303,976 | 287,416 | 268,194 | 75,803 | 27,552 | 143,612 | 177,908 | 279,273 | 293,394 |
| Mexico | 181,802 | 181,166 | 181,447 | 181,709 | 161,321 | 176,499 | 207,004 | 253,187 | 228,779 | 236,349 | 248,366 | 269,241 | 328,549 | 323,784 | 320,831 | 76,598 | 86,141 | 241,183 | 222,688 | 222,845 | 228,209 |
| France | 62,828 | 81,699 | 113,153 | 135,381 | 132,658 | 137,908 | 180,300 | 210,261 | 221,334 | 208,375 | 209,192 | 228,861 | 239,024 | 233,283 | 242,575 | 78,135 | 51,375 | 157,568 | 222,231 | 211,315 | 223,072 |
| New Zealand | 46,847 | 65,266 | 70,141 | 76,162 | 71,230 | 73,027 | 73,533 | 69,970 | 79,588 | 87,652 | 93,173 | 102,868 | 109,763 | 109,524 | 101,703 | 18,592 | 93 | 38,268 | 83,504 | 90,395 | 90,112 |
Between 2005 and 2022, Argentina topped the ranking every normal year. Colombia, which had 72,815 passengers with Chile in 2005, reached 959,146 in 2024 and settled into fifth place; Panama moved up to seventh. Australia is recovering strongly after the pandemic.
Chile's international air passengers: a record in 2025
View the data as a table
| International passengers | |
|---|---|
| 2005 | 4.0 M |
| 2006 | 4.2 M |
| 2007 | 4.9 M |
| 2008 | 4.9 M |
| 2009 | 4.7 M |
| 2010 | 5.1 M |
| 2011 | 6.0 M |
| 2012 | 6.9 M |
| 2013 | 7.0 M |
| 2014 | 7.4 M |
| 2015 | 8.3 M |
| 2016 | 9.3 M |
| 2017 | 10.7 M |
| 2018 | 11.1 M |
| 2019 | 11.1 M |
| 2020 | 3.0 M |
| 2021 | 2.1 M |
| 2022 | 7.0 M |
| 2023 | 9.7 M |
| 2024 | 11.8 M |
| 2025 | 12.3 M |
| Year | International passengers | Change |
|---|---|---|
| 2015 | 8,255,428 | |
| 2017 | 10,718,464 | |
| 2018 | 11,081,228 | +3.4% |
| 2019 | 11,101,107 | +0.2% |
| 2020 | 3,023,912 | -72.8% |
| 2021 | 2,087,600 | -31.0% |
| 2022 | 7,003,438 | +235.5% |
| 2023 | 9,742,897 | +39.1% |
| 2024 | 11,818,713 | +21.3% |
| 2025 | 12,278,197 | +3.9% (record) |
Source: JAC, passengers on international flights in both directions. Santiago airport handles almost all of this traffic: see Chile's airport ranking, the airlines with the most passengers and the busiest air routes.
How 2026 is going: Australia, Türkiye and Canada up; Brazil and Argentina down
| Brazil | 3,312,769 | 2,523,421 | -2.9% |
| Argentina | 2,168,597 | 1,539,660 | -6.1% |
| Peru | 1,833,194 | 1,286,810 | -7.0% |
| United States | 1,108,866 | 787,942 | -4.5% |
| Colombia | 917,576 | 726,851 | 5.8% |
| Spain | 743,807 | 590,247 | 6.4% |
| Panama | 554,865 | 454,526 | 10.1% |
| Australia | 303,365 | 308,384 | 44.8% |
| Uruguay | 293,394 | 207,207 | -4.8% |
| Mexico | 228,209 | 155,495 | -2.8% |
| France | 223,072 | 167,506 | 0.9% |
| New Zealand | 90,112 | 61,957 | -3.8% |
| Dominican Republic | 83,067 | 64,916 | -1.0% |
| Ecuador | 80,379 | 59,521 | 0.8% |
| United Kingdom | 75,051 | 55,512 | 3.0% |
| Paraguay | 69,494 | 47,942 | -7.1% |
| Canada | 56,322 | 45,762 | 53.4% |
| Netherlands | 47,706 | 34,585 | -2.4% |
| Türkiye | 45,519 | 51,839 | 55.2% |
| Bolivia | 42,757 | 46,368 | 53.1% |
From January to September 2026, Chile handled 9,216,451 international passengers, 0.7% fewer than in the same period of 2025. Brazil (-2.9%), Argentina (-6.1%) and Peru (-7.0%) fell, while Australia (+44.8%, with 308,384 passengers, already more than in all of 2025), Türkiye (+55.3%), Canada (+53.4%), Bolivia (+53.1%), Panama (+10.1%), Spain (+6.4%) and Colombia (+5.8%) grew.

Frequently asked questions
Which country has the most air passengers with Chile?
Brazil: 3,312,769 passengers on direct flights in 2025, according to the JAC, followed by Argentina and Peru.
How many international passengers did Chile handle in 2025?
12,278,197, an all-time record, up 3.9% on 2024 and 10.6% above 2019.
Since when has Brazil been ahead of Argentina?
Since 2023. Until 2019, Argentina led every year of the series, which starts in 1984.
Why don't Italy or Germany appear?
Because the JAC records the flight, not the passenger's final destination, and between 2023 and 2025 it recorded no regular direct flights between Chile and those countries.
How to cite this data
Viajando Chile (2026). "Countries with the most air passengers to and from Chile in 2025: Brazil sets a record with 3.3 million and leads Argentina for a third year". viajandochile.com, updated on 17 November 2026. https://viajandochile.com/en/news/countries-with-most-air-passengers-to-chile-2025-ranking-jac. Data: Civil Aviation Board (JAC), air traffic on datos.gob.cl.