*Updated on 16 November 2026.*
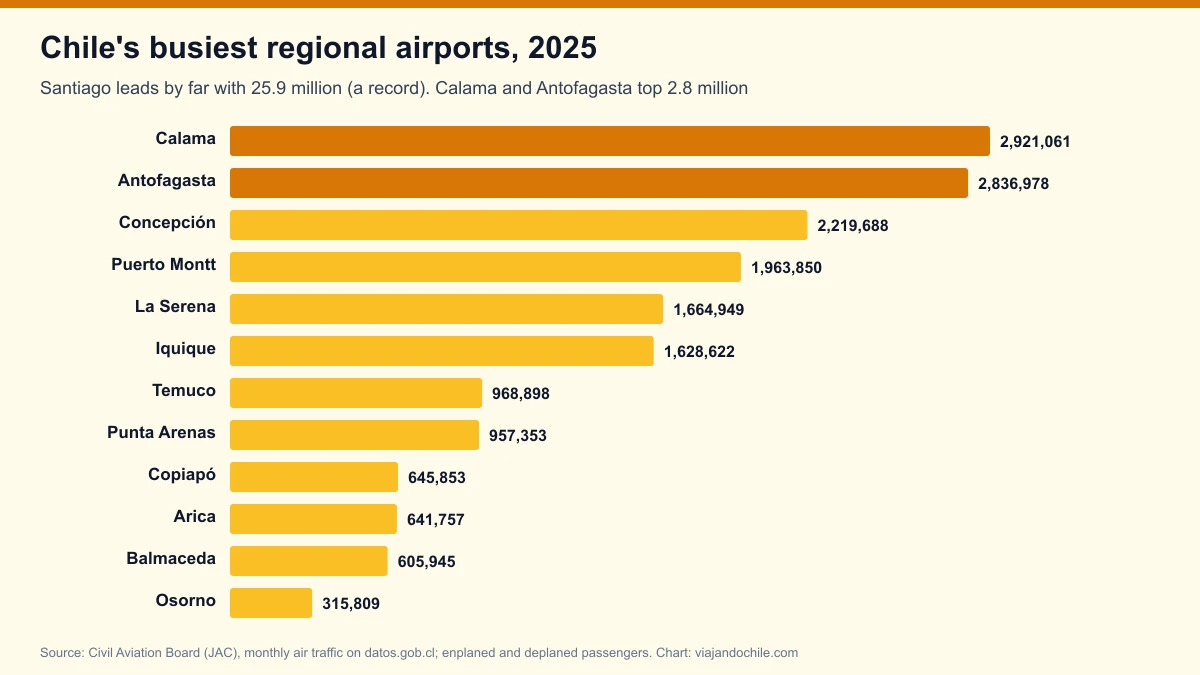
Santiago airport handled 25,941,414 passengers in 2025, the highest figure in its history: 0.4% more than in 2024 and 5.3% above the last pre-pandemic year (2019), according to air traffic data from Chile's [Civil Aviation Board (JAC)](https://datos.gob.cl/dataset/trafico-aereo). Next come Calama, with 2,921,061, and Antofagasta, with 2,836,978: the two northern mining airports are ahead of Concepción and Puerto Montt.
Santiago accounts for 58.3% of the 44.5 million passengers who passed through Chilean airports in 2025. The fastest growers were two tourist destinations: Easter Island (+27.4%) and Puerto Natales (+25.7%), the gateway to Torres del Paine.
View the data as a table
| Passengers at Santiago | 25.94 M |
| Passengers at all airports | 44.49 M |
| Santiago's share | 58.3% |
| Easter Island growth | +27.4% |
Ranking of Chile's busiest airports in 2025
| # | Airport (city) | Passengers 2025 | Change vs 2024 | Change vs 2019 |
|---|---|---|---|---|
| 1 | Arturo Merino Benítez (Santiago) | 25,941,414 | +0.4% | +5.3% |
| 2 | El Loa (Calama) | 2,921,061 | +9.0% | +28.5% |
| 3 | Andrés Sabella (Antofagasta) | 2,836,978 | +7.5% | +30.5% |
| 4 | Carriel Sur (Concepción) | 2,219,688 | -1.8% | +33.3% |
| 5 | El Tepual (Puerto Montt) | 1,963,850 | -1.2% | +1.6% |
| 6 | La Florida (La Serena) | 1,664,949 | -6.1% | +32.1% |
| 7 | Diego Aracena (Iquique) | 1,628,622 | -3.5% | +3.1% |
| 8 | La Araucanía (Temuco) | 968,898 | -13.0% | -5.8% |
| 9 | Carlos Ibáñez del Campo (Punta Arenas) | 957,353 | -0.2% | -27.6% |
| 10 | Desierto de Atacama (Copiapó) | 645,853 | -9.1% | +4.8% |
| 11 | Chacalluta (Arica) | 641,757 | -4.7% | -29.4% |
| 12 | Balmaceda (Coyhaique) | 605,945 | -2.9% | -11.1% |
| 13 | Cañal Bajo (Osorno) | 315,809 | -13.1% | +93.8% |
| 14 | Teniente Julio Gallardo (Puerto Natales) | 310,315 | +25.7% | +1,044% |
| 15 | Mataveri (Easter Island) | 291,994 | +27.4% | -7.1% |
| 16 | Pichoy (Valdivia) | 279,041 | -33.3% | -18.8% |
| 17 | Mocopulli (Castro) | 180,769 | -11.5% | No data in the series |
| 18 | Guardiamarina Zañartu (Puerto Williams) | 44,129 | +26.7% | +19.4% |
Source: JAC monthly (2022-2026) and historical (1984-2025) air traffic, published on datos.gob.cl. Viajando Chile calculation: sum of passengers on each flight segment at its Chilean end, i.e. enplaned plus deplaned passengers on domestic and international flights. Airport names are added for reference; the JAC records traffic by city.
Where Chile's busiest airports are
View the data as a table
| Santiago | 25,941,414 |
| Calama | 2,921,061 |
| Antofagasta | 2,836,978 |
| Concepción | 2,219,688 |
| Puerto Montt | 1,963,850 |
| La Serena | 1,664,949 |
| Iquique | 1,628,622 |
| Temuco | 968,898 |
| Punta Arenas | 957,353 |
| Copiapó | 645,853 |
| Arica | 641,757 |
| Balmaceda | 605,945 |
| Osorno | 315,809 |
| Puerto Natales | 310,315 |
| Isla de Pascua | 291,994 |
| Valdivia | 279,041 |
| Castro | 180,769 |
| Puerto Williams | 44,129 |
The map shows the weight of the mining north: Calama, Antofagasta, Iquique and Copiapó add up to 8 million passengers, many of them workers commuting on rotating shifts to the mines. In the south, Puerto Montt remains the hub for Patagonia and Punta Arenas the gateway to Magallanes.
Santiago, Chile's busiest airport: the series since 2005
View the data as a table
| Santiago | |
|---|---|
| 2005 | 6.64 M |
| 2006 | 6.99 M |
| 2007 | 8.40 M |
| 2008 | 9.02 M |
| 2009 | 9.03 M |
| 2010 | 10.32 M |
| 2011 | 12.11 M |
| 2012 | 14.21 M |
| 2013 | 15.31 M |
| 2014 | 16.07 M |
| 2015 | 17.23 M |
| 2016 | 19.24 M |
| 2017 | 21.43 M |
| 2018 | 23.33 M |
| 2019 | 24.63 M |
| 2020 | 8.53 M |
| 2021 | 9.92 M |
| 2022 | 18.52 M |
| 2023 | 22.92 M |
| 2024 | 25.84 M |
| 2025 | 25.94 M |
| Year | Passengers at Santiago | Milestone |
|---|---|---|
| 2005 | 6,635,325 | |
| 2010 | 10,315,275 | Passes 10 million |
| 2015 | 17,230,567 | |
| 2019 | 24,630,742 | Pre-pandemic record |
| 2020 | 8,527,737 | Borders closed |
| 2021 | 9,916,955 | |
| 2022 | 18,517,172 | Reopening |
| 2023 | 22,923,416 | |
| 2024 | 25,840,584 | New record |
| 2025 | 25,941,414 | All-time record |
| 2026 (Jan-Sep) | 19,243,921 | -1.2% vs Jan-Sep 2025 |
In 2025, 53% of Santiago's traffic was domestic (13.76 million) and 47% international (12.18 million). 2026 is running slower: 19.24 million passengers between January and September, 1.2% fewer than a year earlier, in line with the projected decline we reported. The JAC's September report details the routes.
How Chile's airport ranking has changed since 2010
View the data as a table
| 2010 | 2011 | 2012 | 2013 | 2014 | 2015 | 2016 | 2017 | 2018 | 2019 | 2020 | 2021 | 2022 | 2023 | 2024 | 2025 | |
|---|---|---|---|---|---|---|---|---|---|---|---|---|---|---|---|---|
| Calama | 623,365 | 734,391 | 1,071,445 | 1,441,656 | 1,360,998 | 1,357,426 | 1,438,476 | 1,562,224 | 1,956,147 | 2,273,160 | 976,996 | 1,290,063 | 1,786,542 | 2,228,017 | 2,681,035 | 2,921,061 |
| Antofagasta | 1,172,791 | 1,325,068 | 1,580,040 | 1,863,907 | 2,078,126 | 1,973,777 | 1,901,976 | 1,796,053 | 2,060,635 | 2,173,389 | 1,096,183 | 1,504,531 | 1,998,411 | 2,316,209 | 2,638,595 | 2,836,978 |
| Concepción | 671,495 | 769,421 | 856,428 | 938,276 | 965,470 | 909,032 | 965,838 | 1,120,097 | 1,447,254 | 1,664,824 | 717,670 | 1,112,320 | 1,772,857 | 2,100,019 | 2,259,304 | 2,219,688 |
| Puerto Montt | 821,047 | 929,020 | 1,117,341 | 1,224,814 | 1,272,832 | 1,294,623 | 1,485,959 | 1,596,649 | 1,782,881 | 1,933,553 | 812,697 | 1,097,463 | 1,693,027 | 1,853,375 | 1,988,622 | 1,963,850 |
| La Serena | 377,791 | 507,582 | 606,511 | 662,999 | 725,247 | 759,746 | 775,928 | 811,145 | 1,057,378 | 1,260,780 | 628,488 | 1,024,185 | 1,344,247 | 1,519,659 | 1,773,263 | 1,664,949 |
| Iquique | 847,212 | 1,054,470 | 1,160,017 | 1,250,315 | 1,219,799 | 1,155,306 | 1,196,675 | 1,262,900 | 1,375,949 | 1,579,566 | 871,652 | 1,340,607 | 1,742,945 | 1,802,346 | 1,687,175 | 1,628,622 |
| Temuco | 335,045 | 377,322 | 429,787 | 465,680 | 504,147 | 575,335 | 674,596 | 753,529 | 919,798 | 1,028,340 | 409,080 | 619,997 | 916,053 | 1,059,997 | 1,113,059 | 968,898 |
| Punta Arenas | 559,754 | 610,052 | 674,826 | 740,701 | 777,787 | 819,035 | 994,971 | 1,073,452 | 1,263,177 | 1,323,156 | 505,556 | 574,143 | 959,217 | 967,058 | 958,846 | 957,353 |
| Copiapó | 274,699 | 403,340 | 515,474 | 597,841 | 540,377 | 427,026 | 471,965 | 515,888 | 570,946 | 616,458 | 220,290 | 411,162 | 650,054 | 723,057 | 710,702 | 645,853 |
| Arica | 366,312 | 449,083 | 495,485 | 565,204 | 593,367 | 595,055 | 702,666 | 764,924 | 821,468 | 909,427 | 361,252 | 456,253 | 649,834 | 705,303 | 673,625 | 641,757 |
| Balmaceda | 292,037 | 333,804 | 355,203 | 406,156 | 430,320 | 443,850 | 515,367 | 548,918 | 608,103 | 681,565 | 259,855 | 380,184 | 611,274 | 596,109 | 624,100 | 605,945 |
| Valdivia | 104,852 | 123,346 | 152,053 | 120,504 | 152,620 | 126,592 | 146,267 | 200,275 | 238,779 | 343,654 | 130,942 | 229,993 | 383,949 | 416,436 | 418,395 | 279,041 |
| Osorno | 100,521 | 106,944 | 106,564 | 89,034 | 78,132 | 60,460 | 49,261 | 71,557 | 137,944 | 162,958 | 72,185 | 148,938 | 239,342 | 303,209 | 363,482 | 315,809 |
| Puerto Natales | 2,845 | 5,022 | 8,422 | 5,467 | 1,997 | 2,373 | 5,178 | 24,432 | 18,441 | 27,122 | 48,533 | 57,366 | 122,910 | 187,405 | 246,930 | 310,315 |
| Isla de Pascua | 134,774 | 134,150 | 168,485 | 163,343 | 171,754 | 197,731 | 225,402 | 248,848 | 267,773 | 314,283 | 79,132 | 1,779 | 32,406 | 140,136 | 229,111 | 291,994 |
Calama went from 623,000 passengers in 2010 to 2.92 million in 2025, and has been ahead of Antofagasta since 2024, as it was in 2019. Concepción and La Serena also grew more than 30% compared with 2019. By contrast, Punta Arenas (-27.6%) and Arica (-29.4%) remain well below pre-pandemic levels.
The fastest-growing airports in 2026
With January-September data, total traffic at Chilean airports is down 2.2%. Puerto Natales (+9.3%), Easter Island (+7.5%), Copiapó (+6.1%) and Temuco (+0.9%) are growing; Castro (-30.2%) and Osorno (-20.6%) are falling sharply, the latter with its airfield closed for works in November, as we reported in our Cañal Bajo story.
All of Chile's airports, sortable
| Santiago | Arturo Merino Benítez | 25,941,414 | 0.4% | 5.3% | 19,243,921 | -1.2% |
| Calama | El Loa | 2,921,061 | 9.0% | 28.5% | 2,079,595 | -4.9% |
| Antofagasta | Andrés Sabella | 2,836,978 | 7.5% | 30.5% | 2,060,242 | -2.5% |
| Concepción | Carriel Sur | 2,219,688 | -1.8% | 33.3% | 1,619,335 | -0.7% |
| Puerto Montt | El Tepual | 1,963,850 | -1.2% | 1.6% | 1,394,377 | -4.7% |
| La Serena | La Florida | 1,664,949 | -6.1% | 32.1% | 1,173,542 | -7.0% |
| Iquique | Diego Aracena | 1,628,622 | -3.5% | 3.1% | 1,160,064 | -6.3% |
| Temuco | La Araucanía | 968,898 | -13.0% | -5.8% | 732,750 | 0.9% |
| Punta Arenas | Carlos Ibáñez del Campo | 957,353 | -0.2% | -27.6% | 668,457 | -4.0% |
| Copiapó | Desierto de Atacama | 645,853 | -9.1% | 4.8% | 505,642 | 6.1% |
| Arica | Chacalluta | 641,757 | -4.7% | -29.4% | 467,251 | -3.8% |
| Balmaceda | Balmaceda | 605,945 | -2.9% | -11.1% | 429,069 | -2.6% |
| Osorno | Cañal Bajo | 315,809 | -13.1% | 93.8% | 194,484 | -20.6% |
| Puerto Natales | Teniente Julio Gallardo | 310,315 | 25.7% | 1,044.1% | 226,496 | 9.3% |
| Isla de Pascua | Mataveri | 291,994 | 27.4% | -7.1% | 233,943 | 7.5% |
| Valdivia | Pichoy | 279,041 | -33.3% | -18.8% | 181,314 | -7.8% |
| Castro | Mocopulli | 180,769 | -11.5% | No data | 96,915 | -30.2% |
| Puerto Williams | Guardiamarina Zañartu | 44,129 | 26.7% | 19.4% | 23,807 | -18.5% |
To compare with the rest of the continent, see South America's busiest airports, Chile's busiest air routes and the airlines with most passengers.
Frequently asked questions
Which is the busiest airport in Chile?
Arturo Merino Benítez airport in Santiago, with 25,941,414 passengers in 2025, an all-time record according to the JAC.
Which is Chile's second airport?
El Loa, in Calama, with 2,921,061 passengers in 2025, just ahead of Antofagasta (2,836,978).
How many passengers used Chile's airports in 2025?
44.5 million adding up all airports. A domestic passenger is counted twice, on departure and on arrival, as in airport statistics.
Which airport grew most in 2025?
Among the larger ones, Easter Island (+27.4%) and Puerto Natales (+25.7%).
How to cite this data
Viajando Chile (2026). "Chile's busiest airports in 2025: Santiago sets a record with 25.9 million passengers and Calama overtakes Antofagasta". viajandochile.com, updated on 16 November 2026. https://viajandochile.com/en/news/busiest-airports-in-chile-2025-passenger-ranking-jac. Data: Civil Aviation Board (JAC).